
From my blog, see link for full analysis: https://polimetrics.substack.com/p/copying-the-cops-next-door
Data sourced from Immigration and Customs Enforcement (ICE) website (https://www.ice.gov/doclib/about/offices/ero/287g/participatingAgencies10082025pm.xlsx). Visual made with R.
Reposting because prior post was taken down for not posting on the correct day for US politics (Thursday).
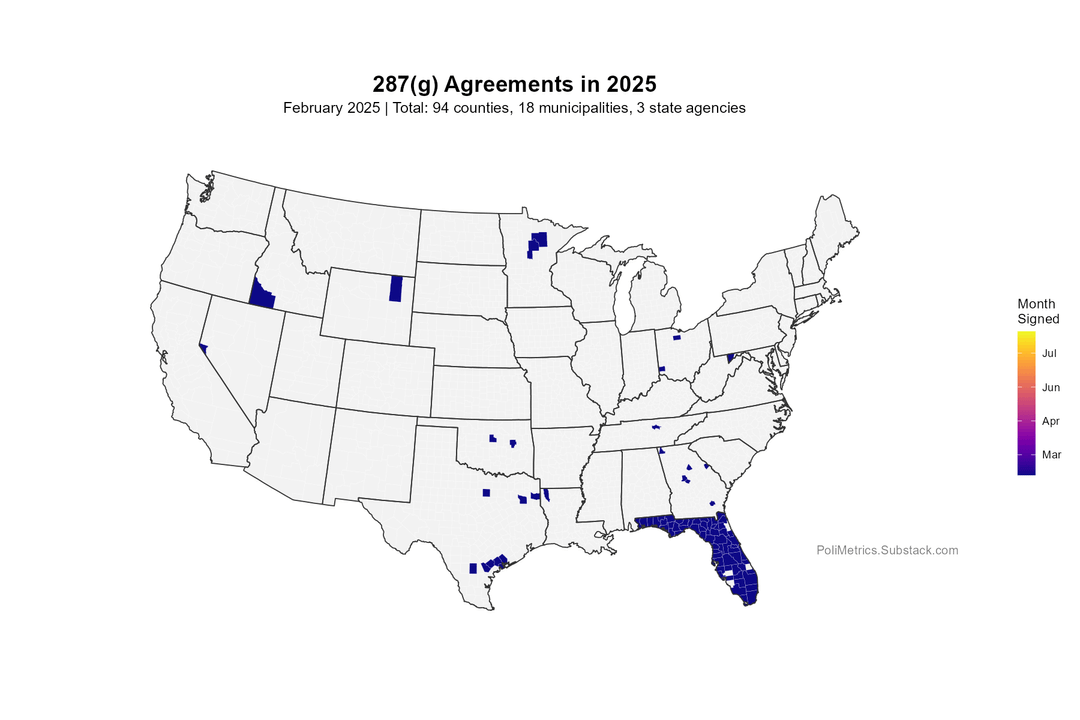
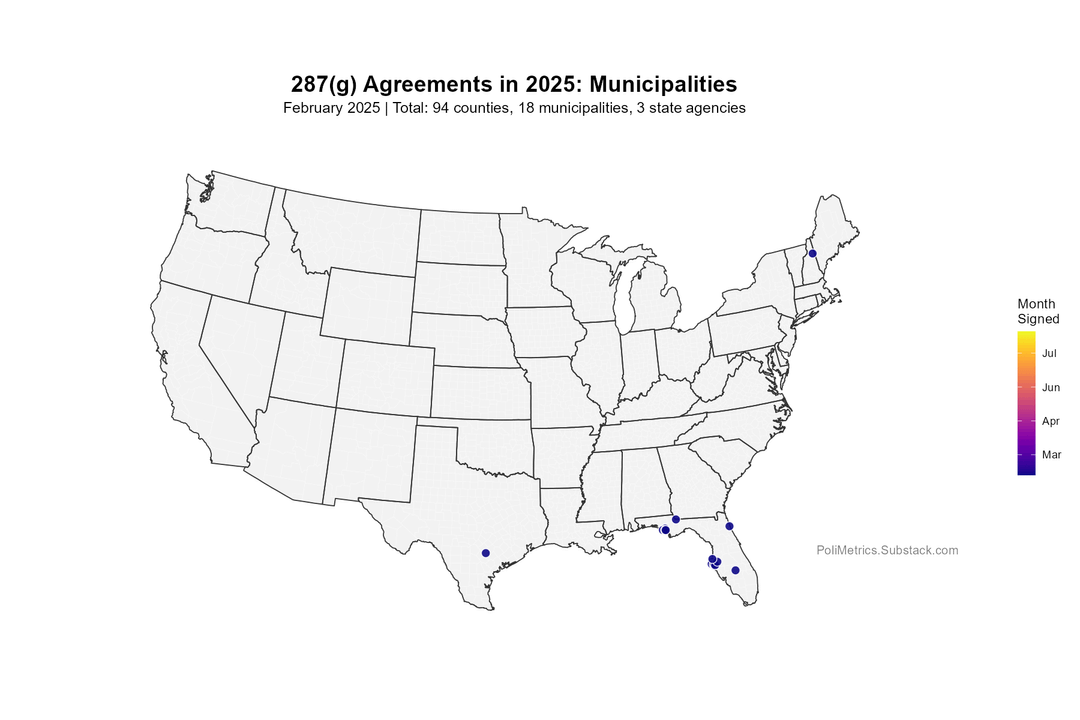
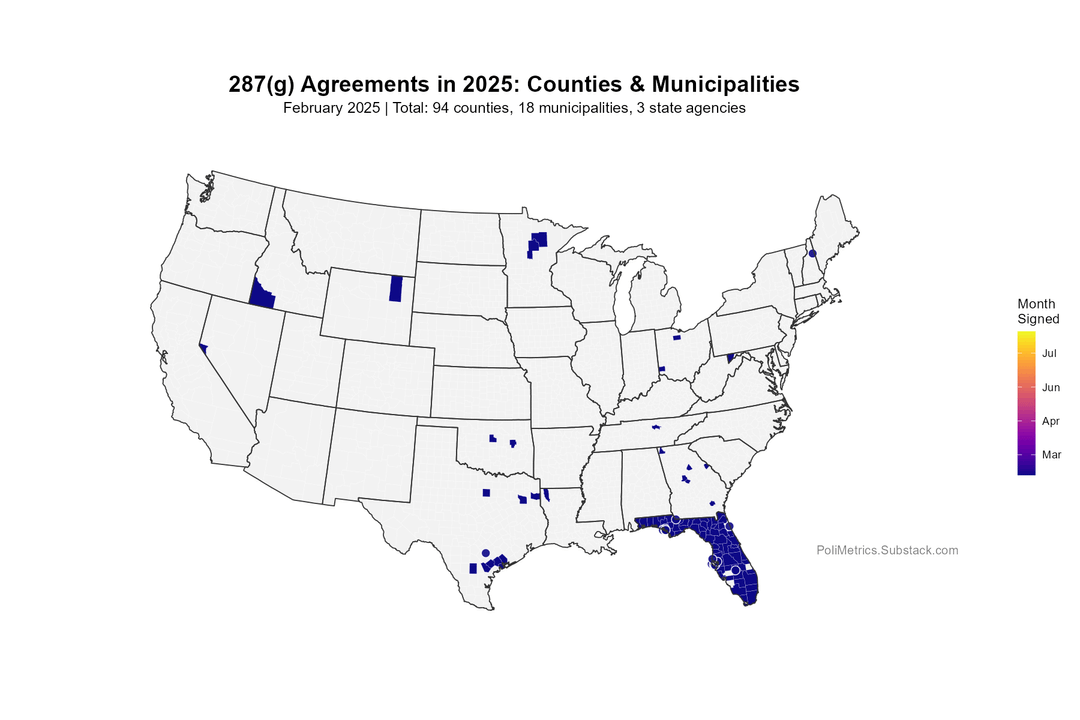
These gifs visualize the rapid geographic diffusion of 287(g) agreements (local law enforcement partnerships with ICE) across U.S. counties and municipalities throughout 2025.
The first GIF shows only counties, the second only municipalities, and the third shows both together.
Key Data Highlights:
• 8x growth in 9 months: 135 localities (Jan 2025) → 1,035 (Sept 2025)
• Heavy geographic concentration: Florida (327 agreements, 32%) and Texas (185 agreements, 18%) account for roughly half of all partnerships nationwide
• Clear wave patterns: The maps show distinct temporal clusters:
• Early 2025: Southeast concentration
• Mid-2025: Expansion through Texas, Oklahoma, Arkansas, Louisiana
• Late 2025: Midwest and Mountain West (Pennsylvania, Utah, Kansas)
What makes this interesting from a data perspective:
The geographic patterns demonstrate textbook policy diffusion – counties don’t adopt randomly, but in regional clusters following their neighbors. The month-to-month progression shows surges immediately after neighboring jurisdictions adopt, showing imitation-driven spread rather than independent decision-making.
Florida’s announcement that all 67 county jails signed simultaneously, and Texas’s 18 agreements unveiled at a single event, created “social proof” cascades visible in the subsequent adoption patterns.
How is your local government deciding whether to cooperate with ICE? Is it based on local opinions? Or just based on what the county next door does?
by Public_Finance_Guy