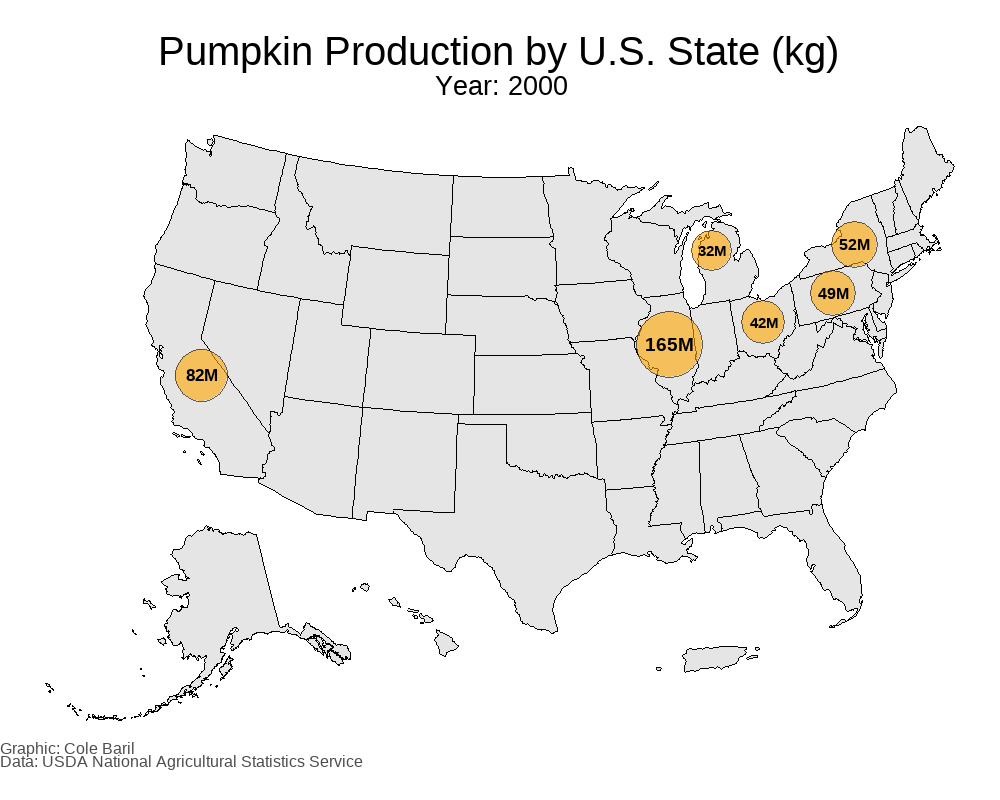
This plot was made using R and ggplot2. As stated in the figure caption, data was obtained from the USDA National Agricultural Statistics Service. by RCodeAndChill
RCodeAndChill on October 9, 2025 4:39 am This plot was made using R and ggplot2. As stated in the figure caption, data was obtained from the USDA National Agricultural Statistics Service.

1 Comment
This plot was made using R and ggplot2. As stated in the figure caption, data was obtained from the USDA National Agricultural Statistics Service.