
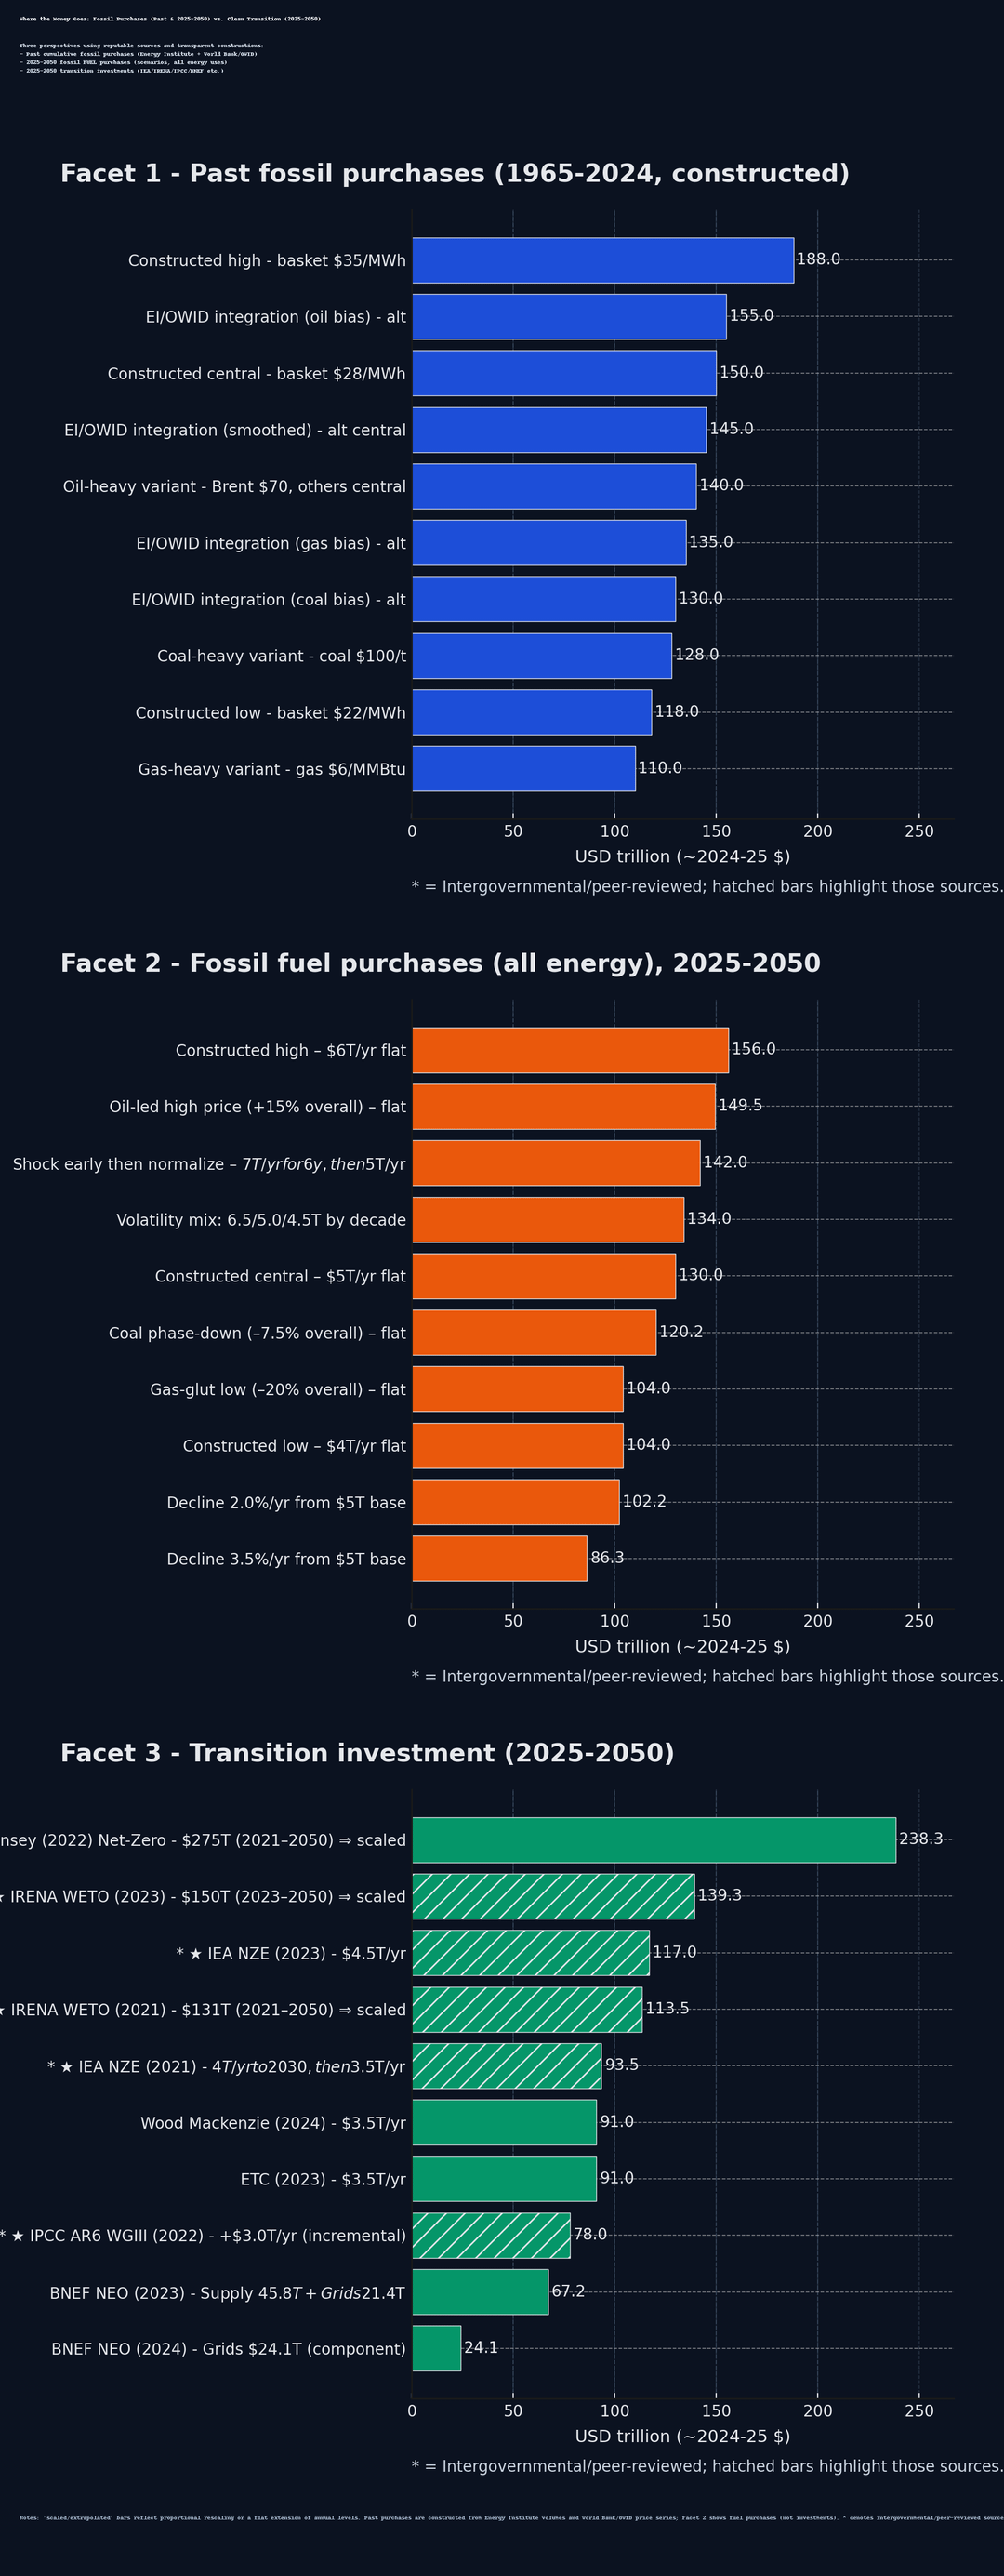
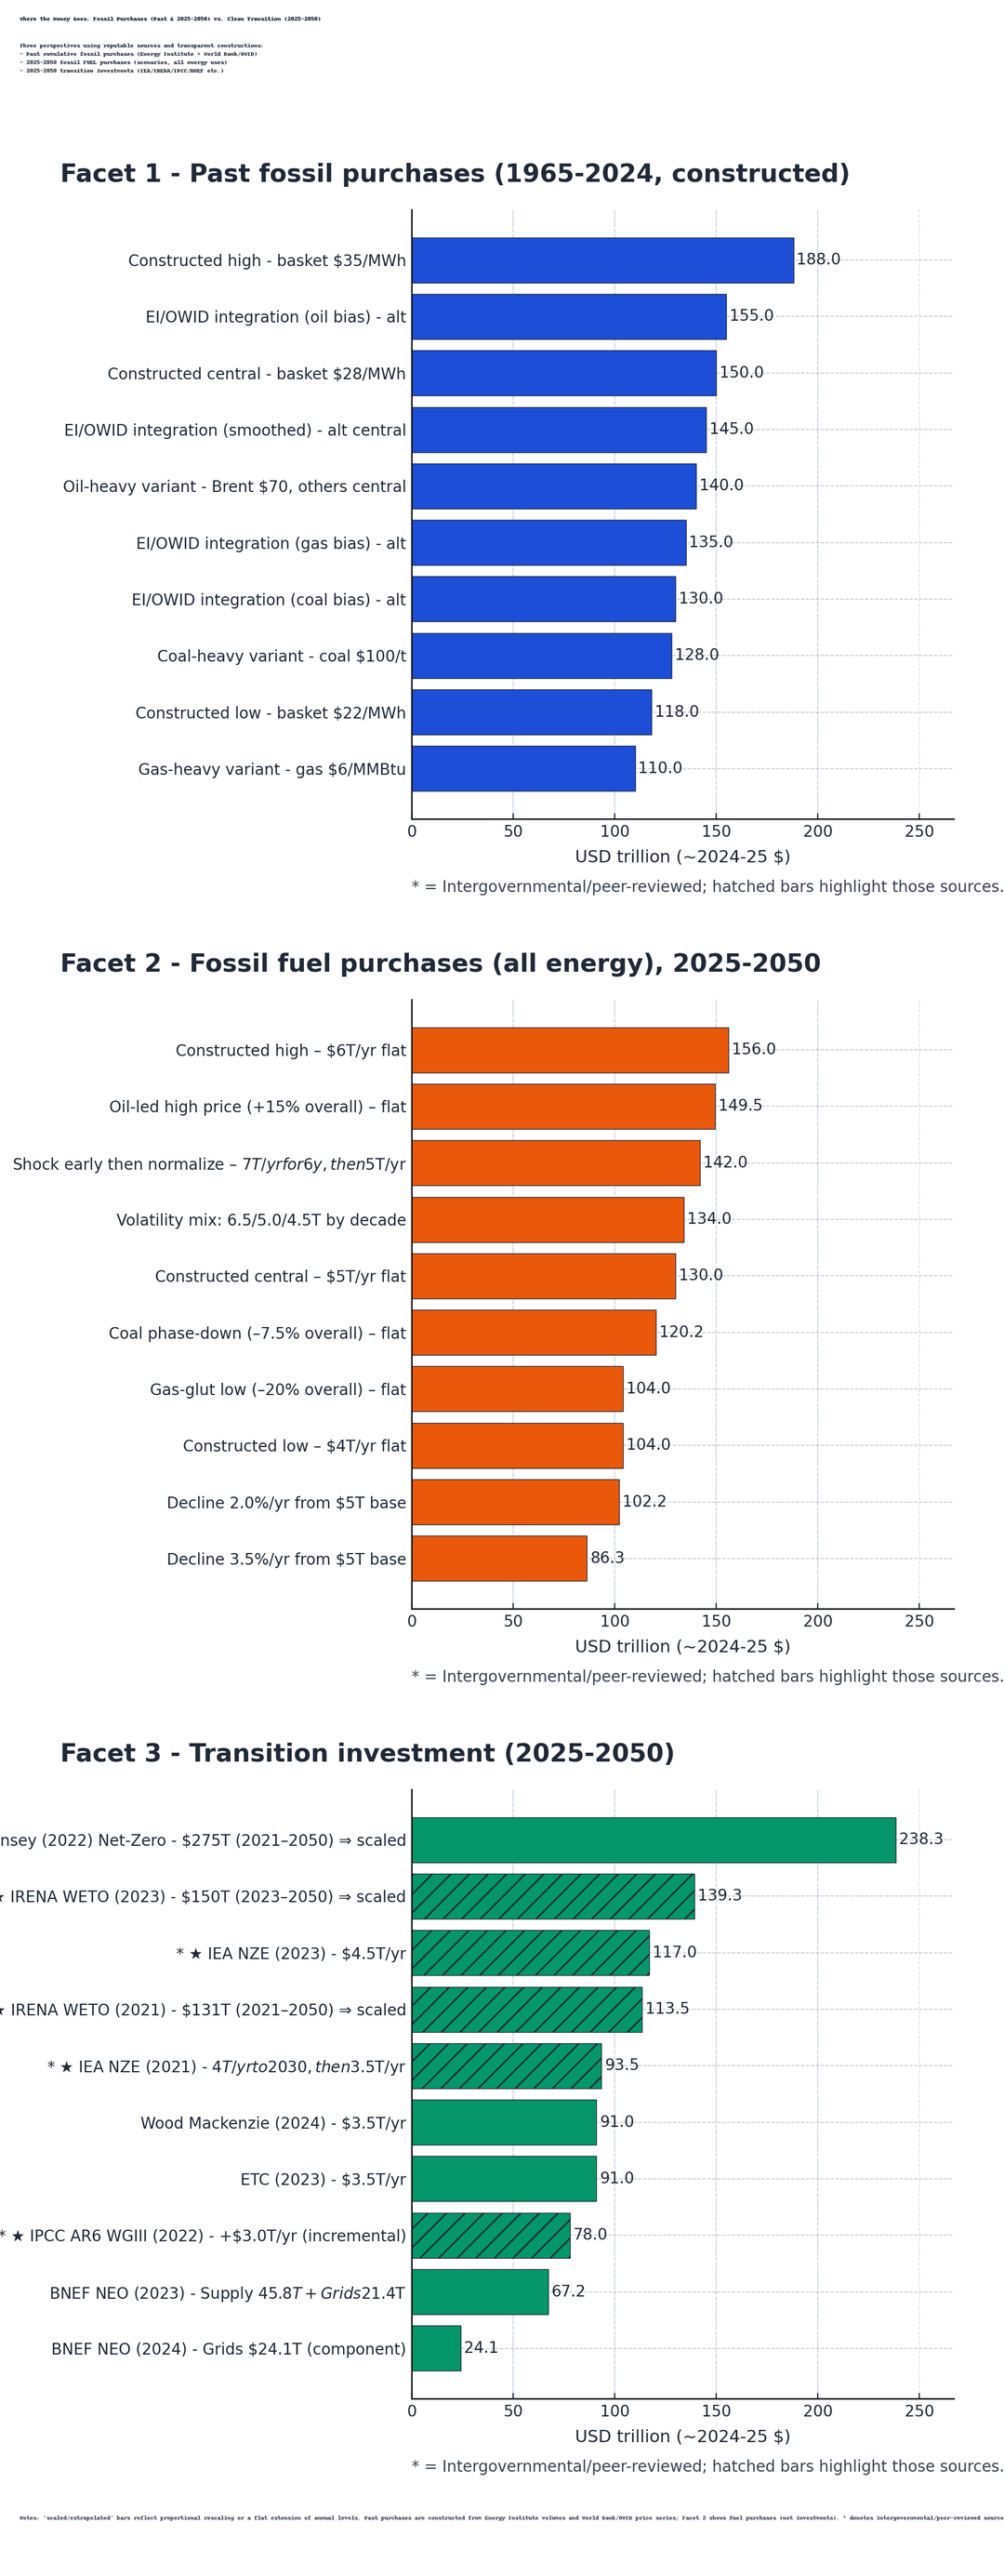
Past = constructed from consumption × prices; 2025–2050 “fuel purchases” are bill scenarios (not CAPEX); transition = published investment totals (rescaled to 2025–2050 when needed).
Plotted with Python/Matplotlib.
Sources
Energy Institute, Statistical Review — volumes: (https://www.energyinst.org/statistical-review)
World Bank, Pink Sheet — prices: (https://www.worldbank.org/en/research/commodity-markets)
Our World in Data — energy/oil prices: (https://ourworldindata.org/energy)
IEA, Net Zero Roadmap: (https://www.iea.org/reports/net-zero-roadmap)
IRENA, World Energy Transitions Outlook 2023: (https://www.irena.org/Publications/2023/Jun/WETO-2023)
BNEF, New Energy Outlook: (https://about.bnef.com/new-energy-outlook/)
IPCC AR6 WGIII: (https://www.ipcc.ch/report/ar6/wg3/)
McKinsey, The Net-Zero Transition: (https://www.mckinsey.com/capabilities/sustainability/our-insights/the-net-zero-transition)
“transition investment” is the generation (wind/solar etc.), grids, and storage/flexibility plus end-use electrification. After it’s built, fuel spend drops sharply
by laowaiH