
Dataset: https://www.kaggle.com/datasets/heitornunes/caffeine-content-of-drinks?resource=download
Tool: julius.ai
by stocktonbroker
Dataset: https://www.kaggle.com/datasets/heitornunes/caffeine-content-of-drinks?resource=download
Tool: julius.ai
by stocktonbroker
8 Comments
do you have an interactive version?
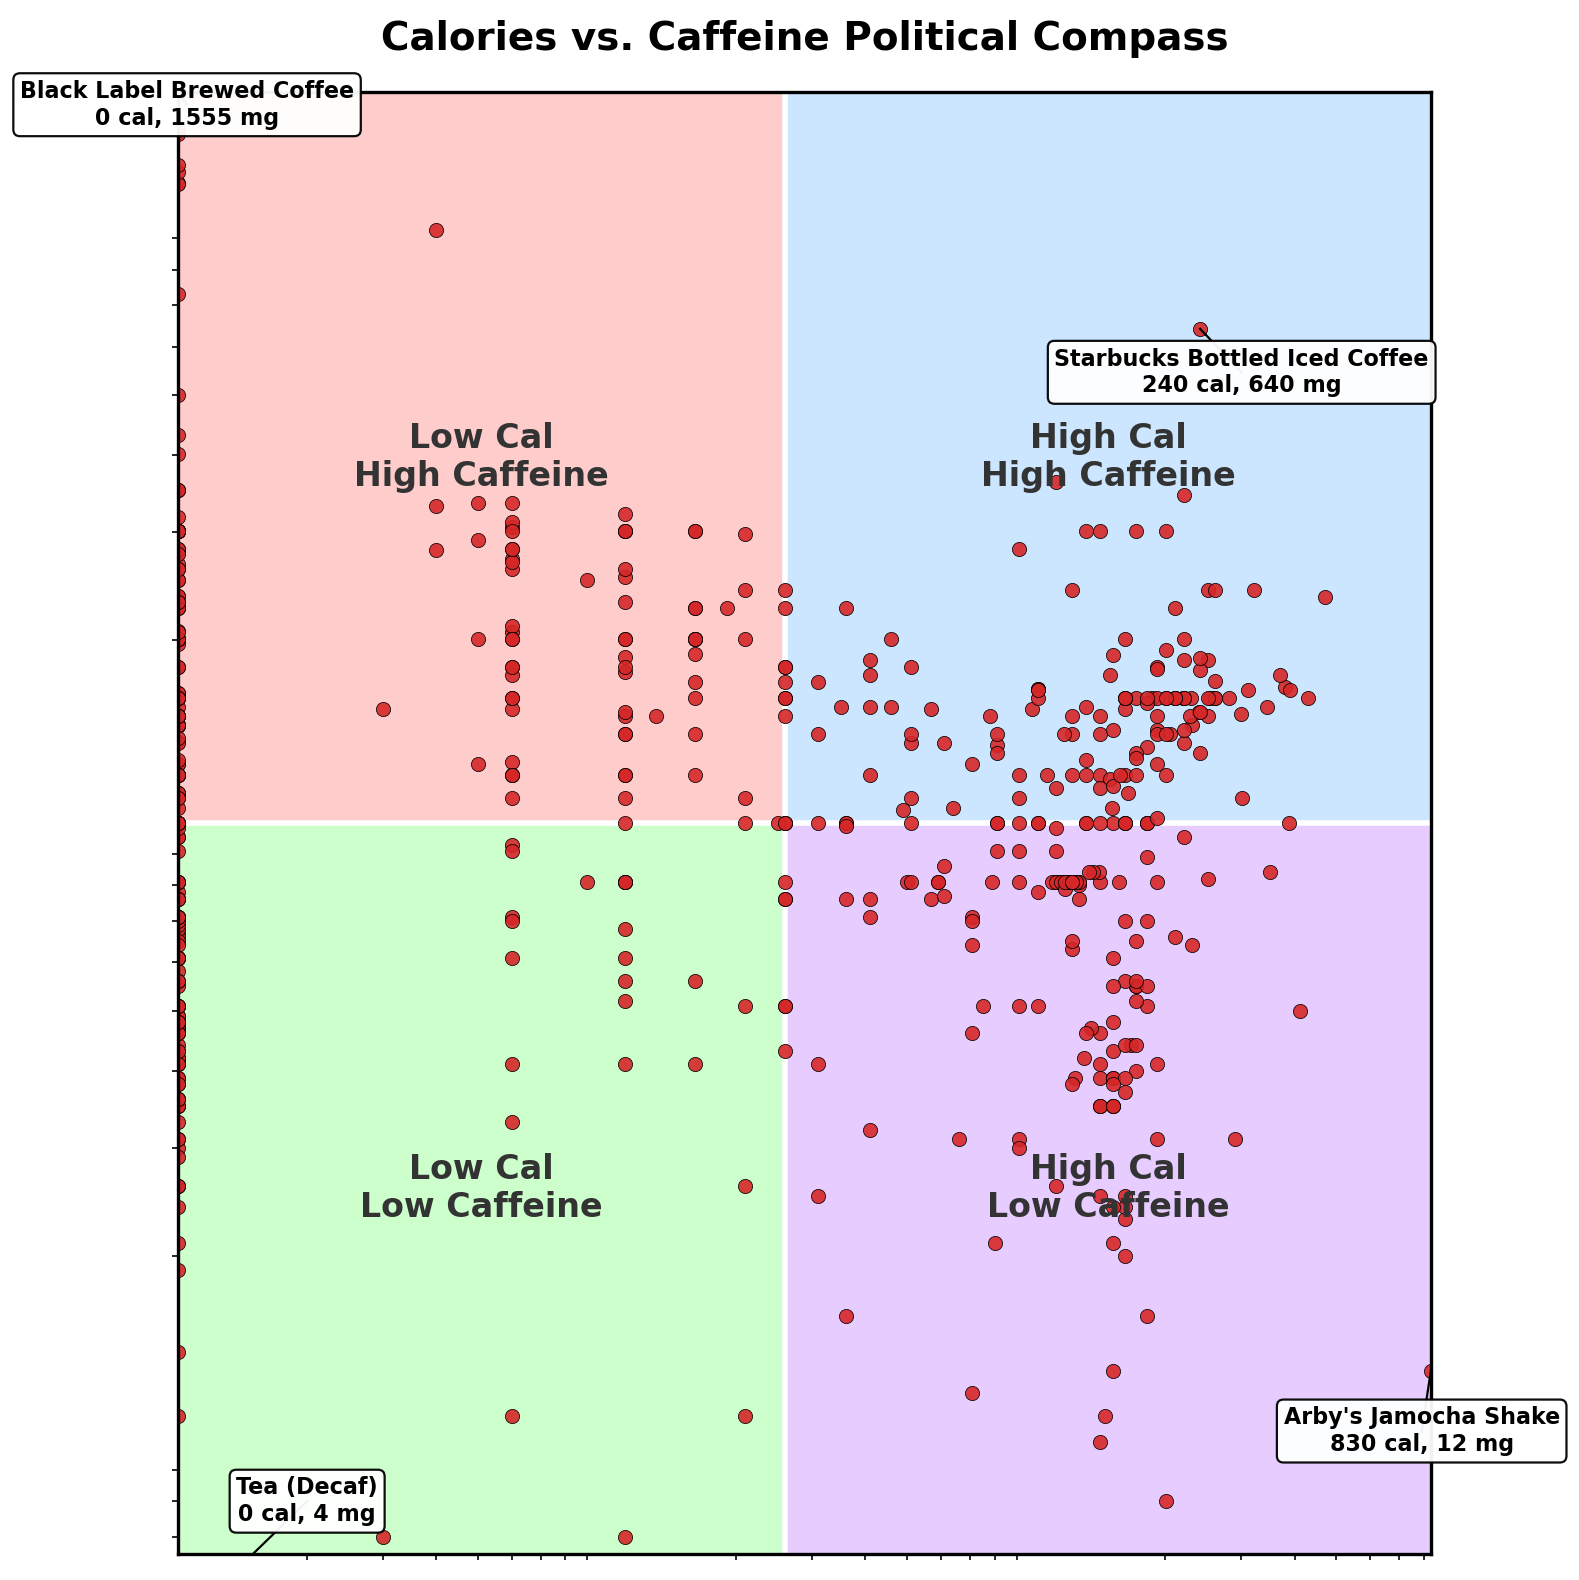
kinda hate how theres 100 drinks mushed into the y axis also why is the “tea (decaf)” label pointed to a point on the graph that seems to represent zero caffeine and nonzero calories?
I was struggling so hard to figure out where political beliefs came into play because of the colors in the graph
Without the ability to see what the drinks are, this is just a bunch of dots on a 4 colored plot. Not “beautiful data” at all.
I get the spread of Caffeine:Cals but how did you assign them to a political ideology? The dataset you provided is just the drink information. Did an AI LLM assign them to a political ideology? Whats the methodology/logic it used?
Just trying to better understand how the determination of where the drink falls on the political spectrum was decided.
Really neat chart otherwise very curious what conclusions can be made from this.
UPDATE: here is an interactive version that is a lot better: [https://julius.ai/s/notebooks/5e7fc1bf-6ef3-456e-89a4-645af433e648?utm_source=share&utm_campaign=notebooks&utm_medium=referral](https://julius.ai/s/notebooks/5e7fc1bf-6ef3-456e-89a4-645af433e648?utm_source=share&utm_campaign=notebooks&utm_medium=referral)
My Ardor energy drinks ❤️ 100mg caffeine and 0 cal
Where do Black Blood of the Earth drinkers fit? 😂