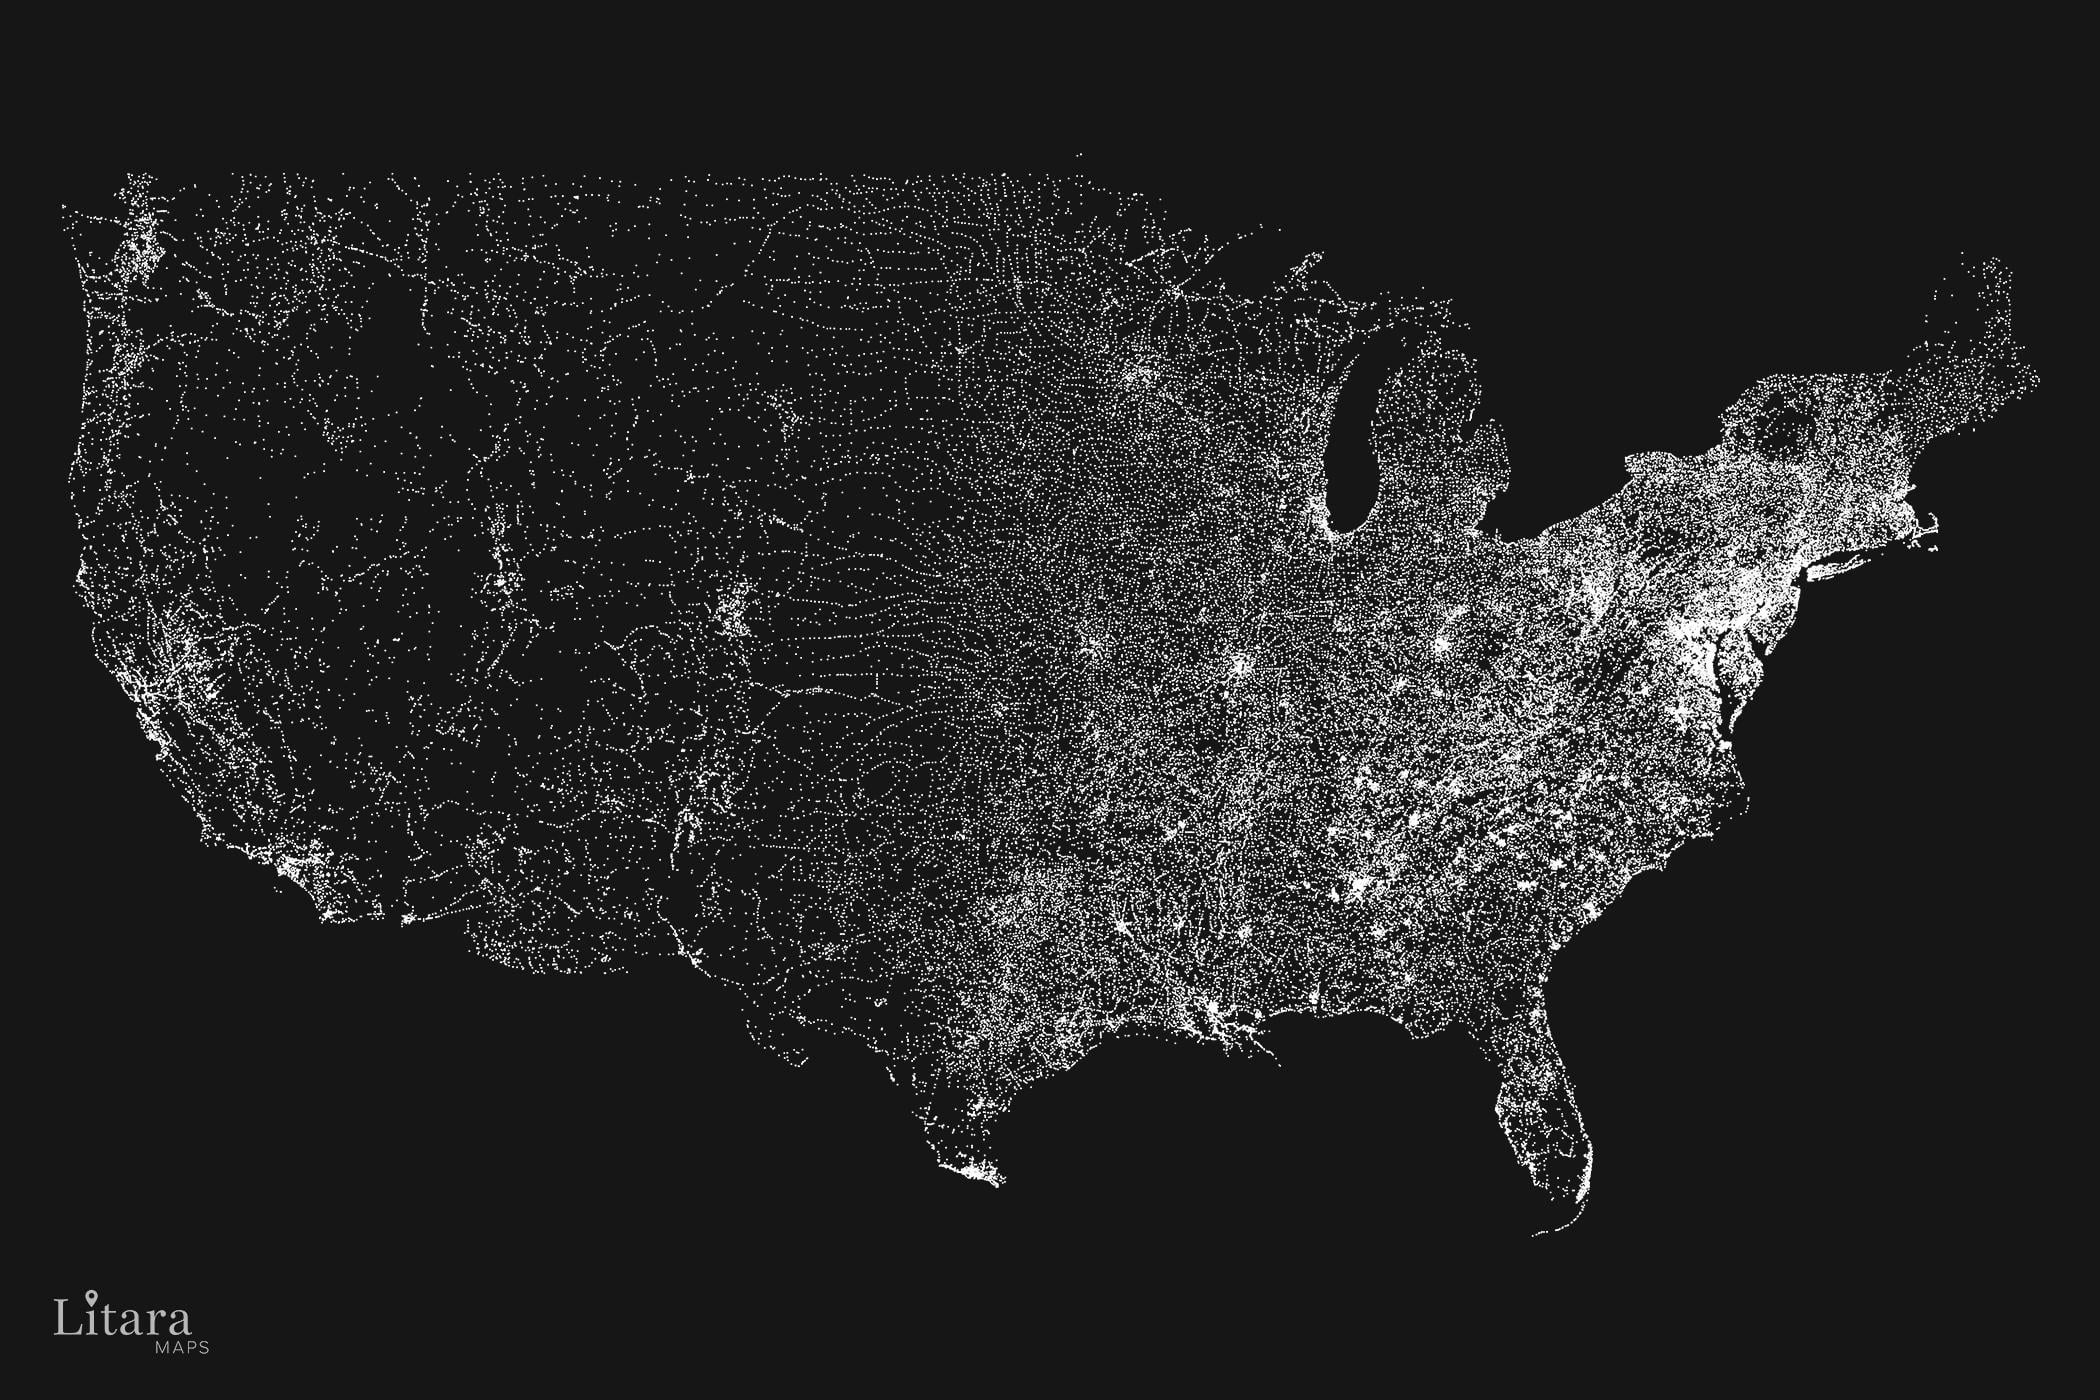
Hey everyone! Thanks for checking out my project. Let me provide a little more context on what you’re seeing 🙂
– Data Source: OSM dataset, filtered for all nodes tagged as place (city, town, village, hamlet). This resulted in over 97,000 unique localities.
– Tool: my custom script.
– Process: The script plots a single white dot for each locality at its precise geographic coordinates.
The size of all dots is the same – whether it’s New York City or a tiny hamlet in Nevada. This isn’t a map of population size, but of settlement presence.
For me it feels less like a map and more like staring at the galaxy 🙂 I found it really beautiful Art and wanted to share with a community that might appreciate it. Happy to answer any questions!
MovingTarget- on
I misread this as “I visited all 97,000+ localities” and I was about to calculate the incredible impossibility of doing so…
I mean, visualization is still impressive regardless, but wow.
thearchiguy on
Crazy how Nevada’s outline is pretty visible. It’s an empty state.

5 Comments
Hey everyone! Thanks for checking out my project. Let me provide a little more context on what you’re seeing 🙂
– Data Source: OSM dataset, filtered for all nodes tagged as place (city, town, village, hamlet). This resulted in over 97,000 unique localities.
– Tool: my custom script.
– Process: The script plots a single white dot for each locality at its precise geographic coordinates.
The size of all dots is the same – whether it’s New York City or a tiny hamlet in Nevada. This isn’t a map of population size, but of settlement presence.
For me it feels less like a map and more like staring at the galaxy 🙂 I found it really beautiful Art and wanted to share with a community that might appreciate it. Happy to answer any questions!
I misread this as “I visited all 97,000+ localities” and I was about to calculate the incredible impossibility of doing so…
I mean, visualization is still impressive regardless, but wow.
Crazy how Nevada’s outline is pretty visible. It’s an empty state.
[Rule 1](https://www.reddit.com/r/dataisbeautiful/wiki/rules/rule1): “If the visualization features spatial data, geographic position alone is not sufficient. **It must be more than dots on a map.**”
Can you provide a link to the original high resolution version? It drives me crazy how Reddit recently started down-rezing images. Thank you!