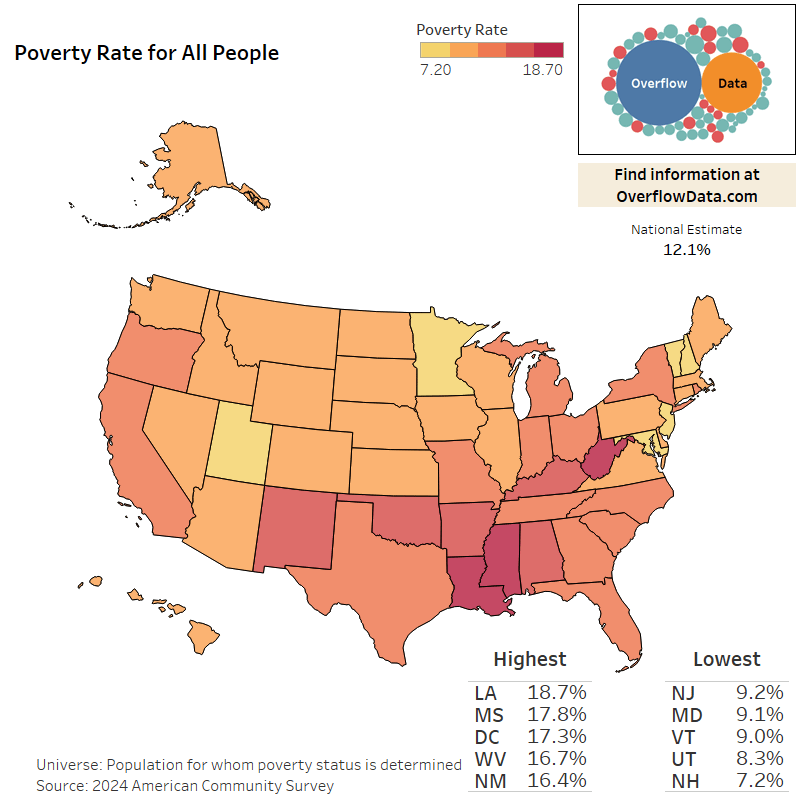
This data viz shows the poverty rate in each state. The visualization was created in Tableau and the data comes from the 2024 American Community Survey.
Let me know what topic you would like to see mapped next.
Charming_Pirate on
Can we overlay the red states for funsies
ZanthorTitanius on
Someone else on the sub started calling this “The Map” in that almost every statistical map of the US looks like this. New England and Minnesota are the bright colors, the southeast can choose between red and black depending on the graphs color scheme
This matches perfectly with the prisoners per 100k people map
scootunit on
The color scale is obtuse
Victims_R_Us on
Your post history reminds me of Steve Ballmer’s “Just the Facts”
– I am really curious to see if state populations fluctuated more than normal in the past 4 years.
– I am also curious about gun ownership in this same type of map. There is a common theme of liberal states not having firearms and I wonder if there is a similar theme here.
– If I wanted to learn more about how you do this: What direction would you send someone on?
– Any direct books you would recommend or am I assuming you are a stat geek who went bonkers in College to do this awesome stuff?
elykl12 on
Huey Long would be spinning in his grave
syntactyx on
another New Hampshire W. Live Free or Die!
CaliTexan22 on
If you adjust for COL, the mao looks different. Last I heard, CA was tied with LA for worst…
thewimsey on
People need to use their eyes and actually look at the map.
It is *not* the same as the other maps; NY, CA, and OR have the same amount of poverty as GA, TN, SC, NC, FL, TX, etc. And more than most of the great plains states like MT, ID, ND, SD, NB, KS, IA, etc.
underlander on
I appreciate the use of an intuitive color gradient but I think the colors could be a bit more saturated to help us eyeball the corresponding values. I swear Louisiana is not the same color as the dark red on the legend.
samandtoast on
Minnesota always standing out.
ComradeGibbon on
Clears throat. Poverty isn’t just about money.
GSilky on
Correlates to something else as well folks.
summane on
Louisians only will get worse, a new Republican governor who invites Meta to parasitize the land and suck up all the power and water.
marquettemi on
Yeah whatever.
Jimmy Kimmel was suspended from his TV show for a coupe weeks!
That’s the big news. Not the fact that these two major parties do not submit, or pass, meaningful legislation for the working class to help prevent these rates of poverty.

19 Comments
This data viz shows the poverty rate in each state. The visualization was created in Tableau and the data comes from the 2024 American Community Survey.
You can find an interactive version of this information in the [State Data Explorer](https://overflowdata.com/state-data/) I have created.
Let me know what topic you would like to see mapped next.
Can we overlay the red states for funsies
Someone else on the sub started calling this “The Map” in that almost every statistical map of the US looks like this. New England and Minnesota are the bright colors, the southeast can choose between red and black depending on the graphs color scheme
[https://en.wikipedia.org/wiki/Thank_God_for_Mississippi](https://en.wikipedia.org/wiki/Thank_God_for_Mississippi)
So, the usual suspects then?
It’s a whole lot higher than that
This matches perfectly with the prisoners per 100k people map
The color scale is obtuse
Your post history reminds me of Steve Ballmer’s “Just the Facts”
– I am really curious to see if state populations fluctuated more than normal in the past 4 years.
– I am also curious about gun ownership in this same type of map. There is a common theme of liberal states not having firearms and I wonder if there is a similar theme here.
– If I wanted to learn more about how you do this: What direction would you send someone on?
– Any direct books you would recommend or am I assuming you are a stat geek who went bonkers in College to do this awesome stuff?
Huey Long would be spinning in his grave
another New Hampshire W. Live Free or Die!
If you adjust for COL, the mao looks different. Last I heard, CA was tied with LA for worst…
People need to use their eyes and actually look at the map.
It is *not* the same as the other maps; NY, CA, and OR have the same amount of poverty as GA, TN, SC, NC, FL, TX, etc. And more than most of the great plains states like MT, ID, ND, SD, NB, KS, IA, etc.
I appreciate the use of an intuitive color gradient but I think the colors could be a bit more saturated to help us eyeball the corresponding values. I swear Louisiana is not the same color as the dark red on the legend.
Minnesota always standing out.
Clears throat. Poverty isn’t just about money.
Correlates to something else as well folks.
Louisians only will get worse, a new Republican governor who invites Meta to parasitize the land and suck up all the power and water.
Yeah whatever.
Jimmy Kimmel was suspended from his TV show for a coupe weeks!
That’s the big news. Not the fact that these two major parties do not submit, or pass, meaningful legislation for the working class to help prevent these rates of poverty.