
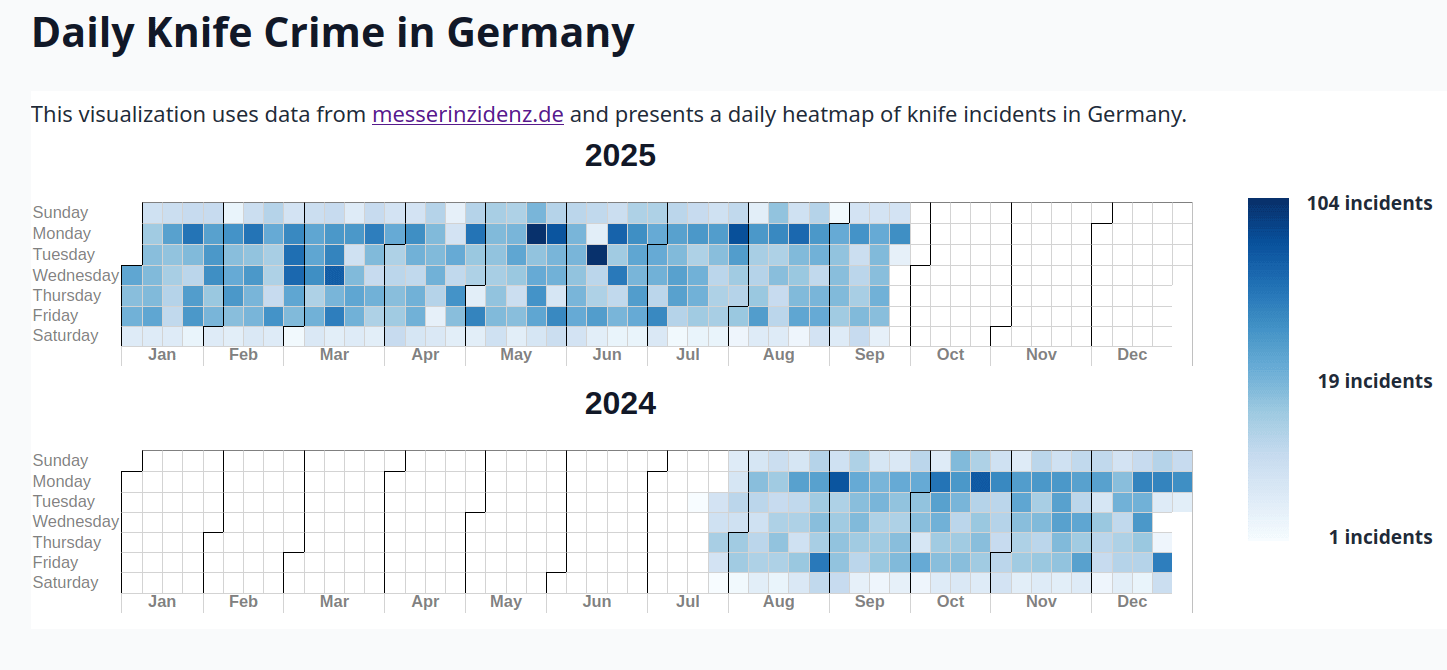
This visualization uses data from https://messerinzidenz.de/daten and shows a daily heatmap of knife-related incidents across Germany.
The image is a screenshot of an interactive HTML visualization created in Python. I built it with my own module tabheatcal, which generates calendar-style heatmaps in HTML. The package is available on PyPI and GitHub (not sure if sharing this type of links is allowed here).
by No_Pineapple449