
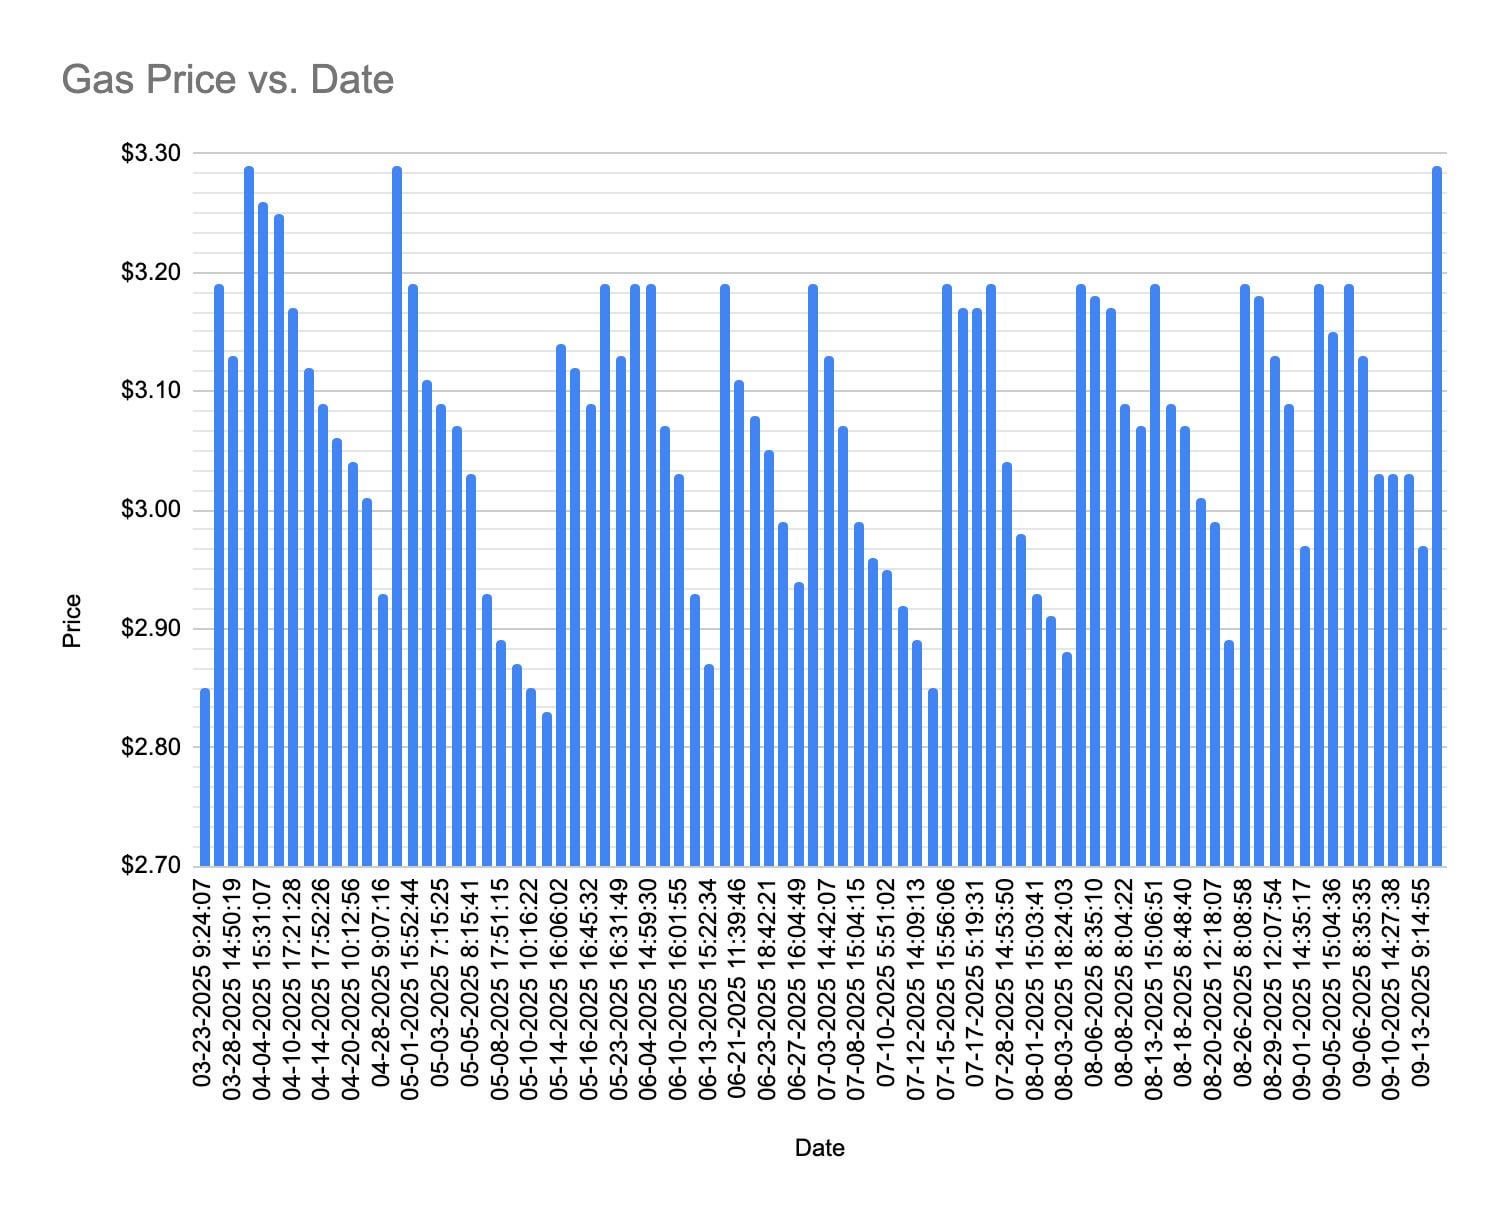
I noticed that at my local gas station, the gas price will spike to $3.19, then slowly drift down, only to spike back to $3.19 again. There's a few exceptions, of course, but the general trend pretty clear. This trend has been going on for at least a year and I finally decided to start keeping track using my iPhone/Siri to just note the gas price every time I drive by the gas station.
It's the same gas station near Temple Terrace, FL (just east of Tampa).
by MysteriousLeader6187
5 Comments
Wow… love the graph, great job putting everything together.
Side note – I cant remember the last time ive seen gas in the $2.xx range
The Midwest has a lot of this: https://www.stlouisfed.org/on-the-economy/2016/may/why-gas-prices-cycle-midwest
Side note: I noticed the frequency of oscillation changed during Covid, thought that was odd, maybe due somehow to the lower demand
Yeah, it’s always up by dimes, down by pennies.
This is a famous trend called edgeworth cycles. It’s considered one way to have a stable equilibrium of relatively higher prices.
I bet the gas doesn’t change price all that much, and what they’re doing is psychological manipulation tactics. If you see the price go down a few cents, you’re more likely to fill up. If you see the gas went up that day, you’re gonna keep driving to the next stop or wait for the next day. People are more likely to stop at this gas station, because as far as they know, most days the price is a few cents cheaper than they remember seeing it before. Then, raising the price back up only hurts sales for that one day, so you only raise it once and make it count.