
I hope mobile sized graphs are OK 🙏
The source is from an interactive Federal budget estimates analysis tool that I recently built. All of the data comes from government estimates
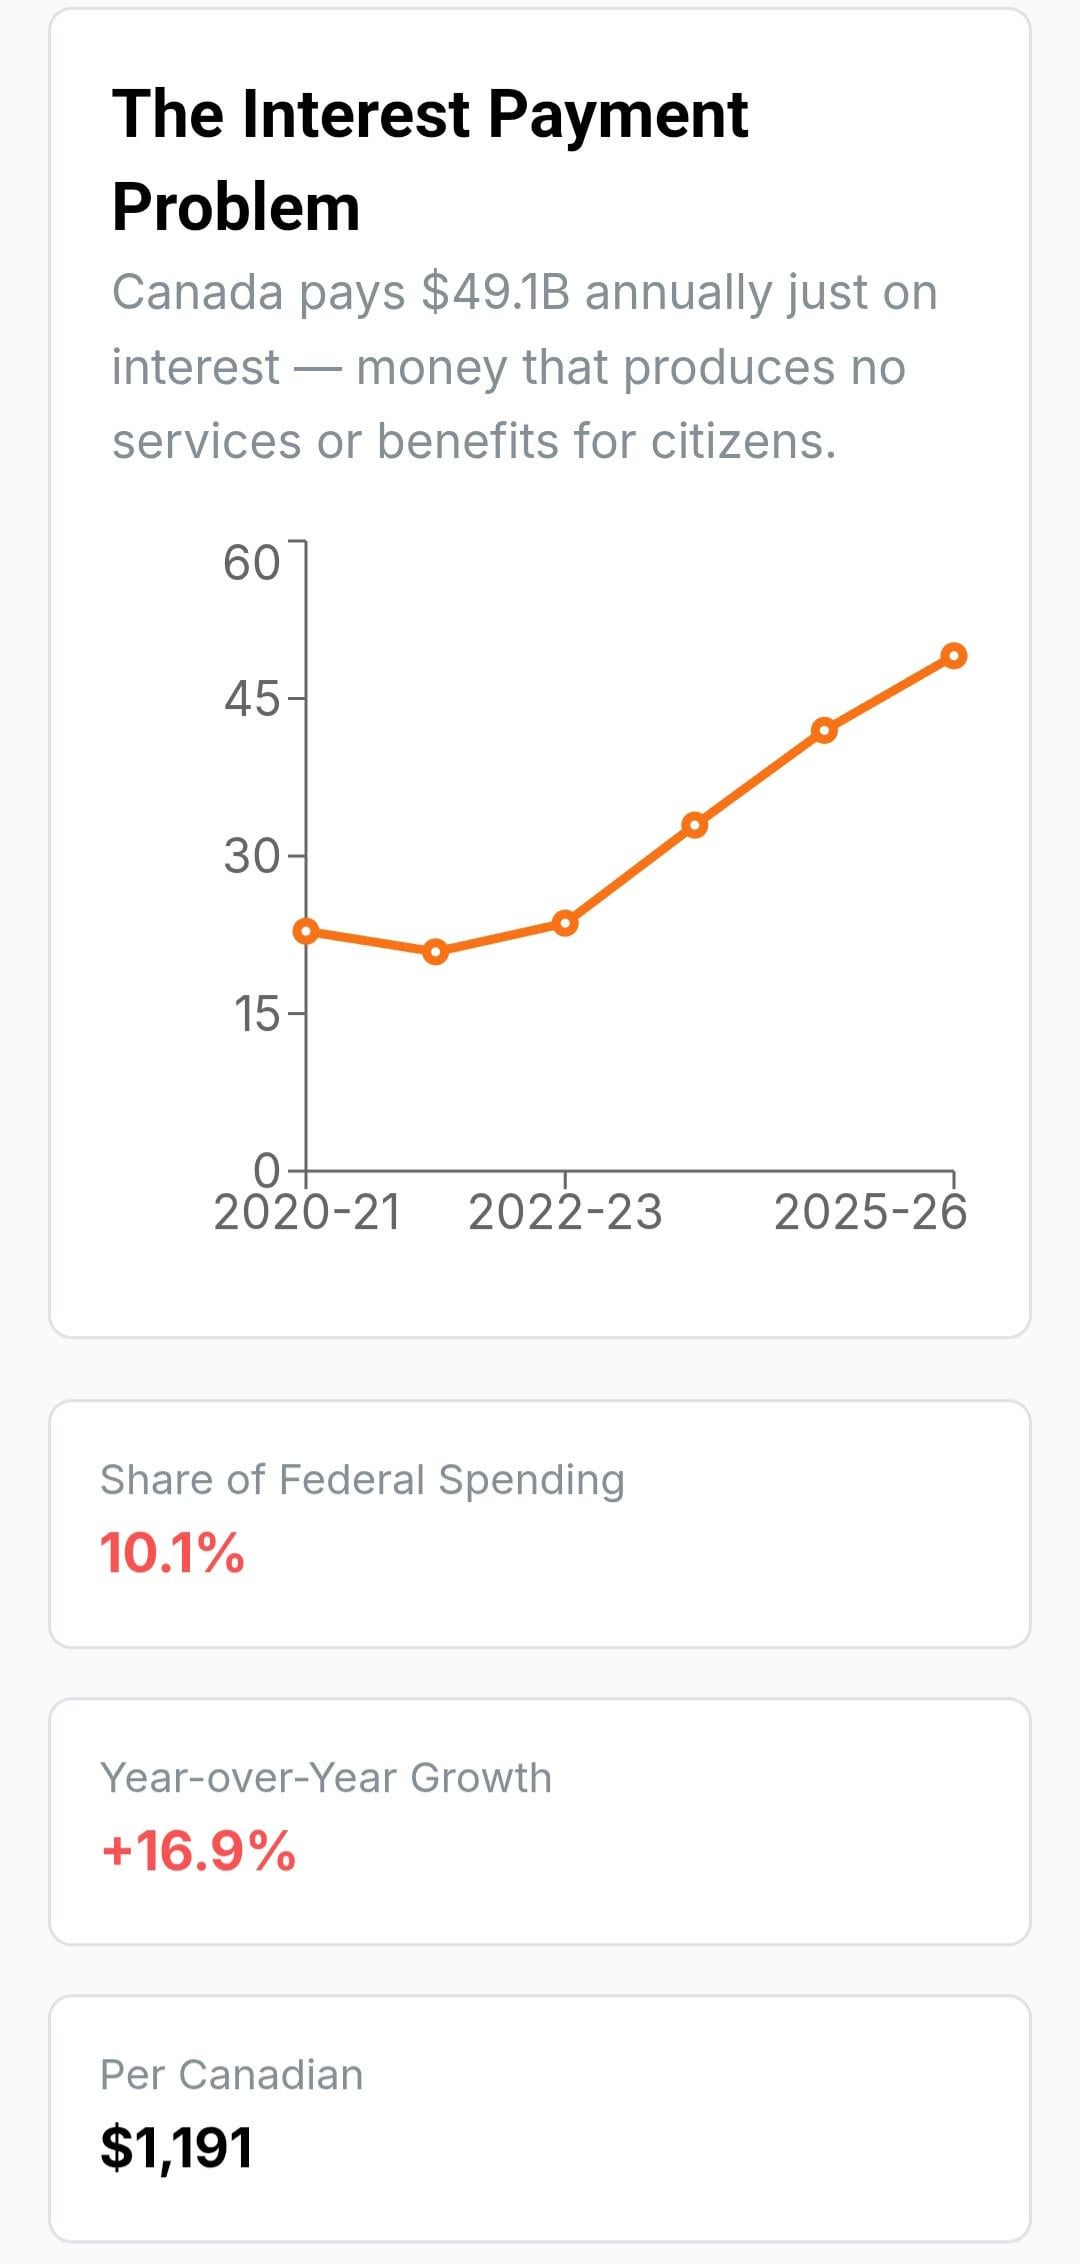
Source of chart/data: https://myparliament.ca/budget
Im sorry to non-canadians who are unable to access the website, currently Im being ddos by bots so IPs not originating from Canada are blocked. (Vpn will work)
by myparliamentCA
4 Comments
Source: https://myparliament.ca/budget
Tool: https://myparliament.ca/budget
Canadians hate debt.
Fuck you fmr PM Brian Mulroney
It’s kind of reductive to say that the interest payments “produce no services or benefits to canadian citizens” because the loans that interest attaches to have been spent/invested in a way that produces services and/or benefits and the interest is part of that.
It doesn’t directly pay for them of course but you wouldn’t have them without those debts and interest payments either.
Looks like this started growing after the pandemic so how much of that debt went to supporting Canadian citizens through the pandemic? Genuine question as I’m from the UK and don’t know – if the company we worked for was shut down, we got 80% of our wages paid (up to a limit I can’t remember but was above median wage) and that cost a lot, and produced a lot of debt and interest payments, but we’d be worse off without it.
You might also have direct investments which are paying back more money than the interest rates – like if you borrowed money to build social housing which gets rented at a profit that more than covers the interest payments related to it.
In terms of the data itself, it’s more usual to look at debt:GDP ratio rather than the nominal amount of debt/interest but perhaps in this case comparing the % of federal spending over time would be a better way to examine this data. Big problem with nominal figures is that it doesn’t take into account inflation or economic growth.
Is their debt growing or shrinking?