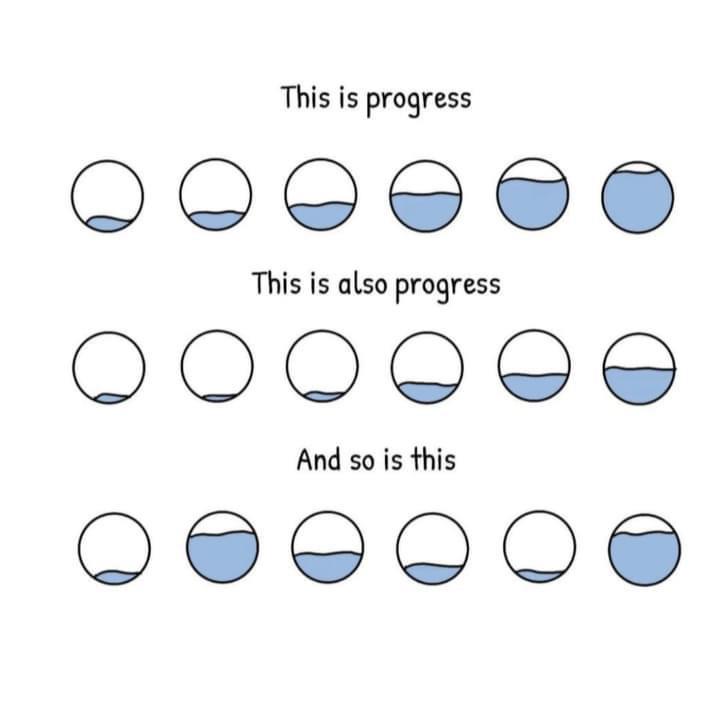
I don’t understand how to interpret this image. Suppose each bubble shows the amount of money you have on your bank account each year.
– The first two rows show that you’re saving more and more money. Cool: if you want more money, you’re making progress towards getting even more money.
– In last row you won a lottery twice, but overall your income has been either low or declining, especially in the middle part. Is this progress?
Progress seems to be movement _towards_ some goal. Graphs showing progress should have a trend. The first two do, but the last one doesn’t have a clear trend, it seems either random or mostly declining.
> Progress is the process of _gradually_ improving or getting nearer to achieving or completing something.
If “progress” here means “filling _more_ of the bubble over time”, then the last row doesn’t show this. The middle of the row shows a decline, while the second and last bubbles show random unexplained bursts of success that seem more like luck than gradual improvement or development.

1 Comment
I don’t understand how to interpret this image. Suppose each bubble shows the amount of money you have on your bank account each year.
– The first two rows show that you’re saving more and more money. Cool: if you want more money, you’re making progress towards getting even more money.
– In last row you won a lottery twice, but overall your income has been either low or declining, especially in the middle part. Is this progress?
Progress seems to be movement _towards_ some goal. Graphs showing progress should have a trend. The first two do, but the last one doesn’t have a clear trend, it seems either random or mostly declining.
> Progress is the process of _gradually_ improving or getting nearer to achieving or completing something.
https://www.collinsdictionary.com/dictionary/english/progress
> movement forward or _toward_ a place.
>
> the process of improving or developing something over a period of time
https://www.britannica.com/dictionary/progress
If “progress” here means “filling _more_ of the bubble over time”, then the last row doesn’t show this. The middle of the row shows a decline, while the second and last bubbles show random unexplained bursts of success that seem more like luck than gradual improvement or development.