
Original source article: https://aqalgroup.com/2024-worldwide-ghg-emissions/
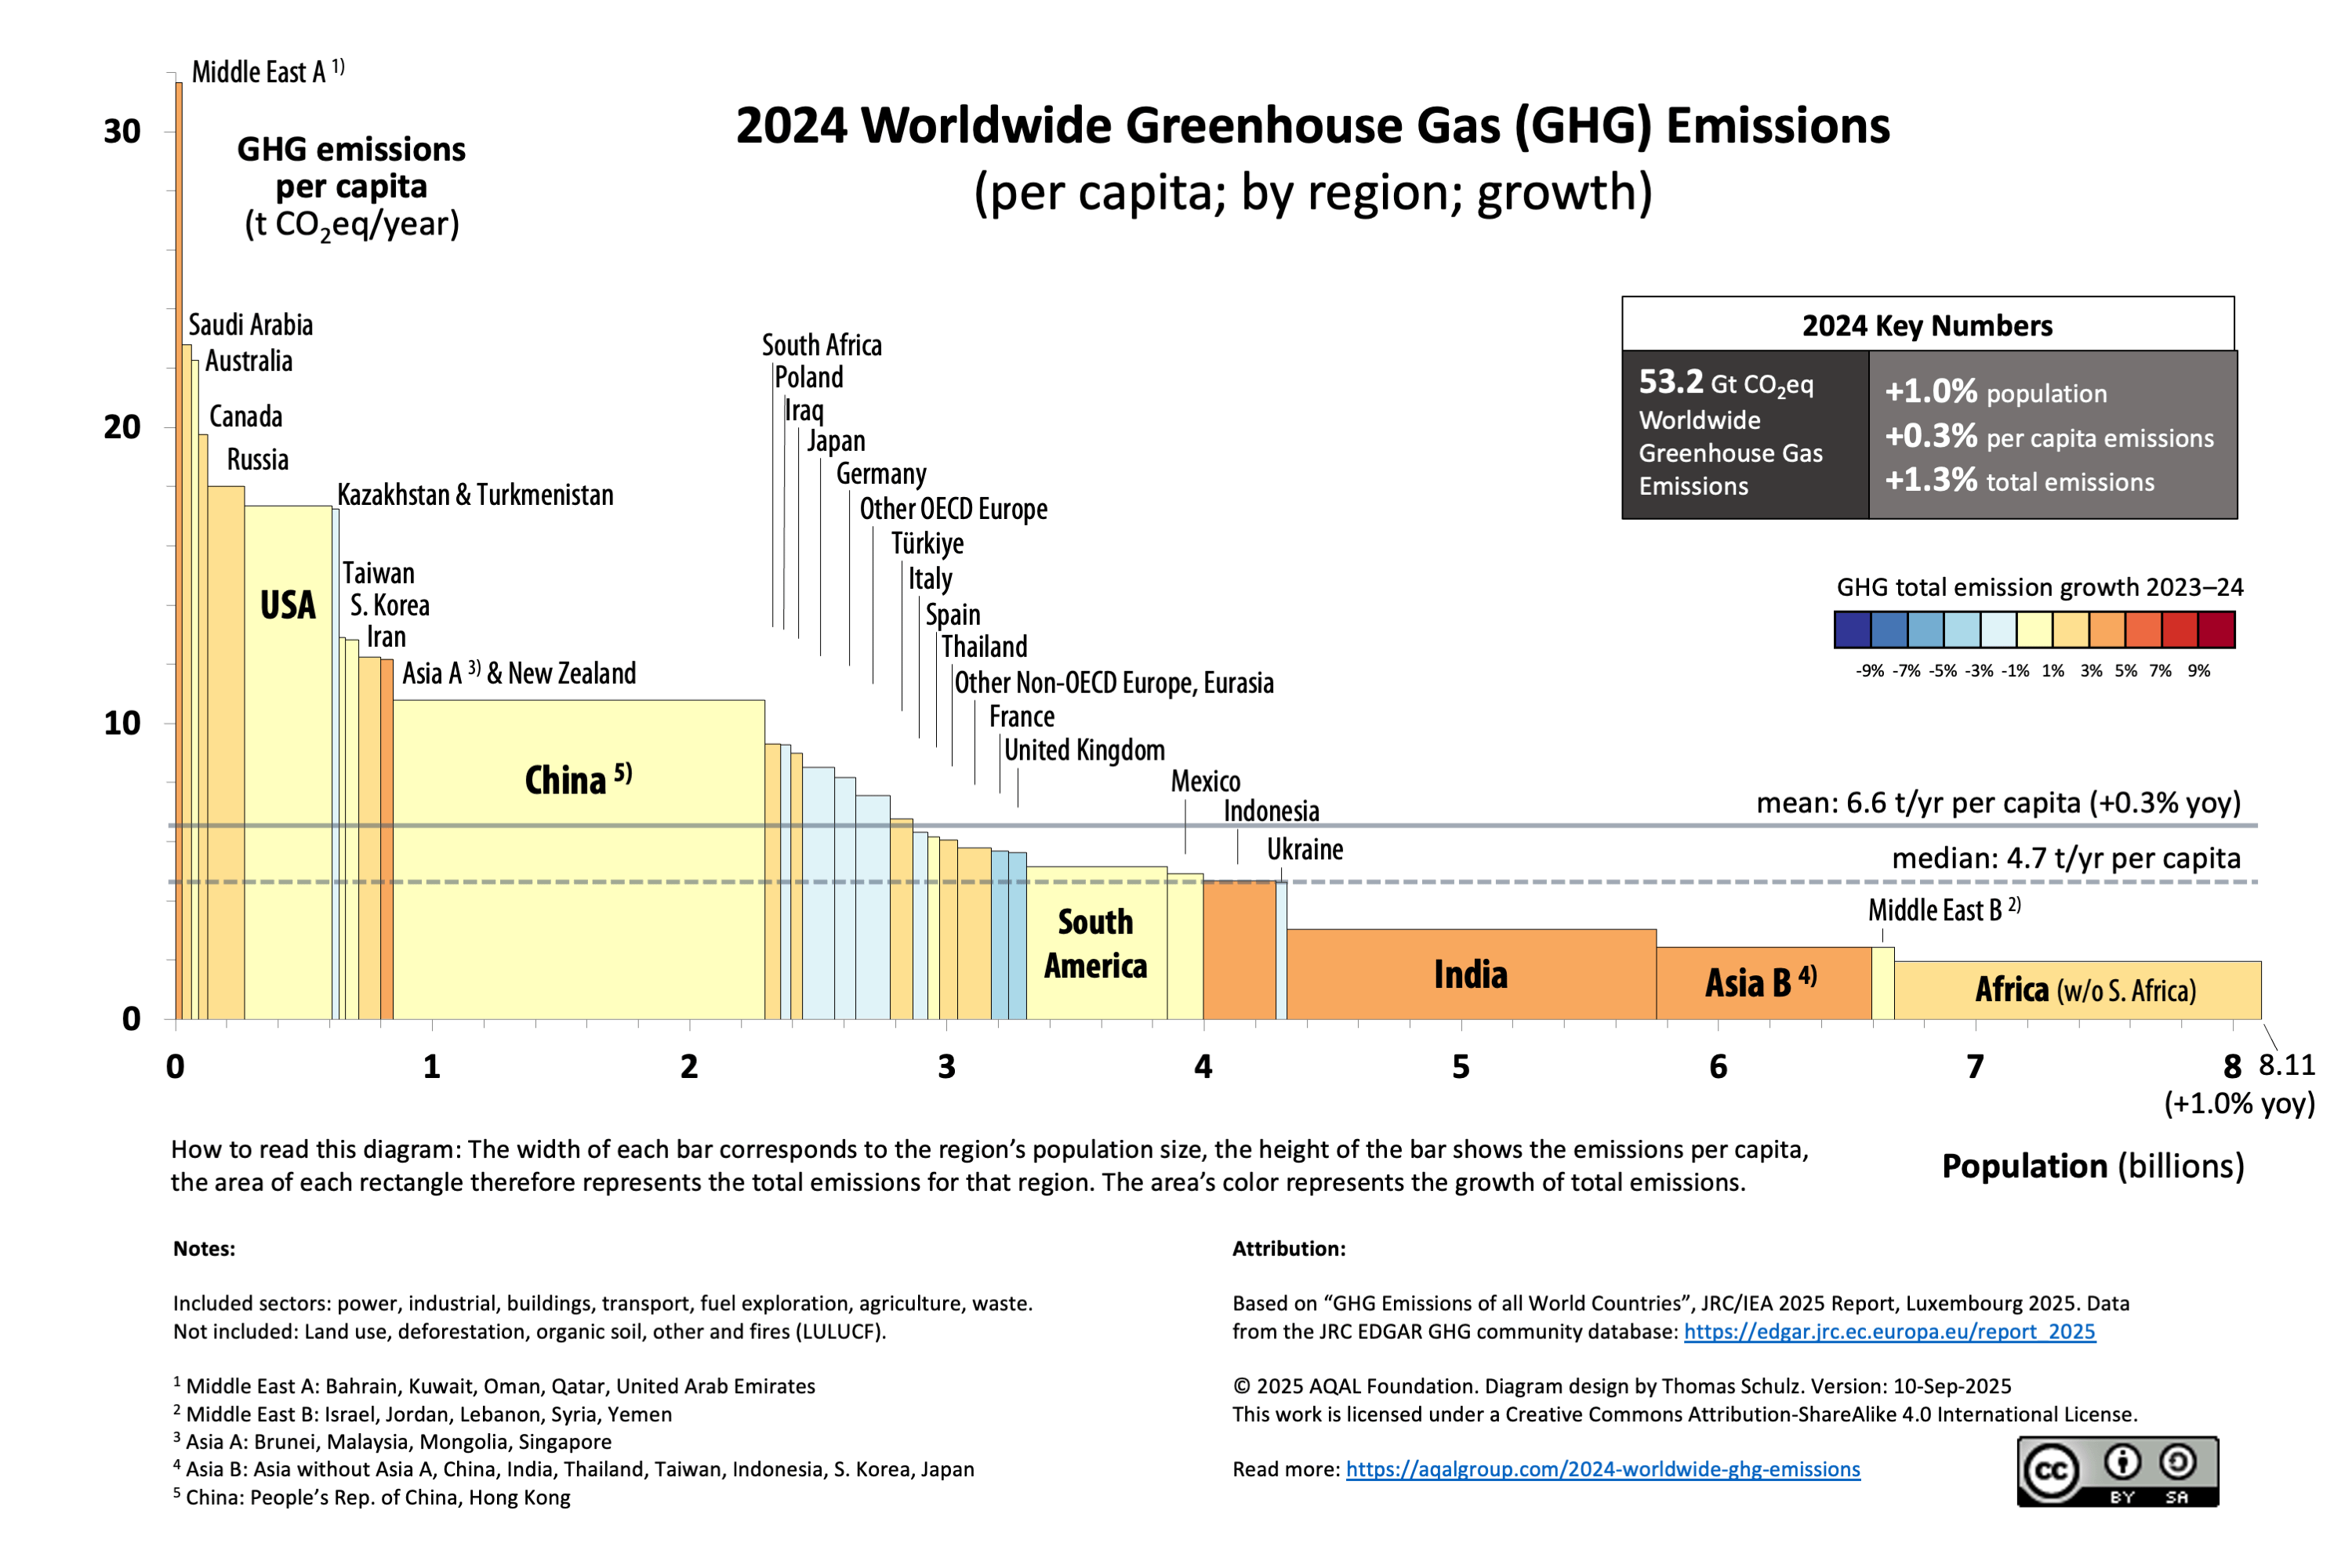
The variwide diagram shows how polarized the world is in regard to GHG emissions.
Data source: EDGAR (Emissions Database for Global Atmospheric Research) Community GHG Database. Reference: Crippa, M., Guizzardi, D., Pagani, F., Banja, M., Muntean, M. et al., GHG emissions of all world countries – 2025 Report, Publications Office of the European Union, Luxembourg, 2025, doi:10.2760/9816914, JRC143227.
Tools used: Excel, Peltier Tech Charts for Excel, Powerpoint
by Firm-Force9829