
Texas requires nearly 15,000 water systems to send out water quality reports to customers. I grabbed the last ~15 years of them (~225,000 individual Word documents).
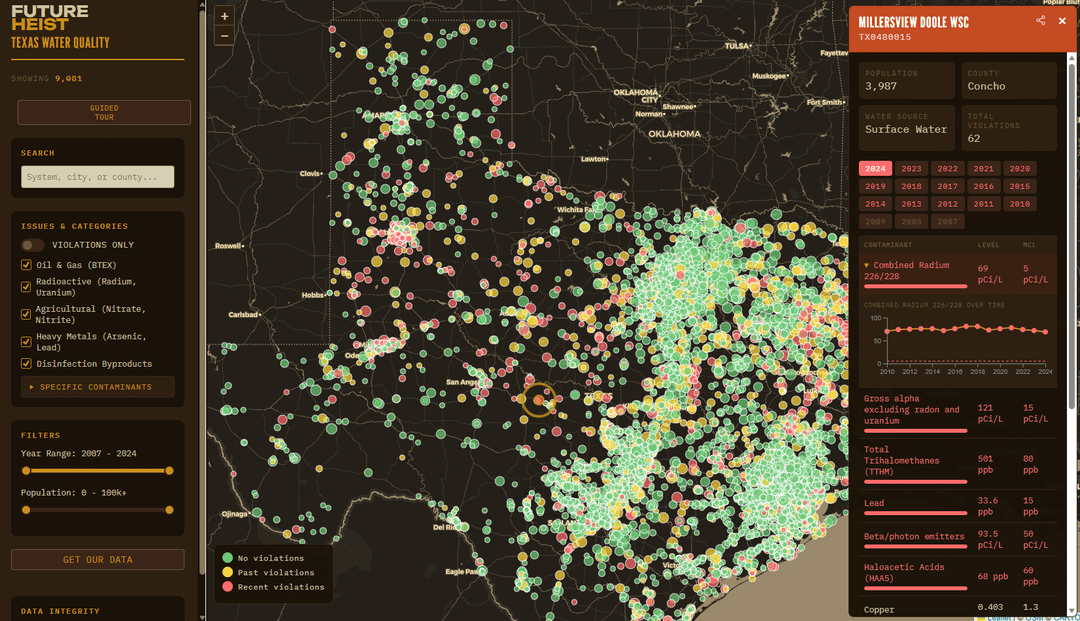
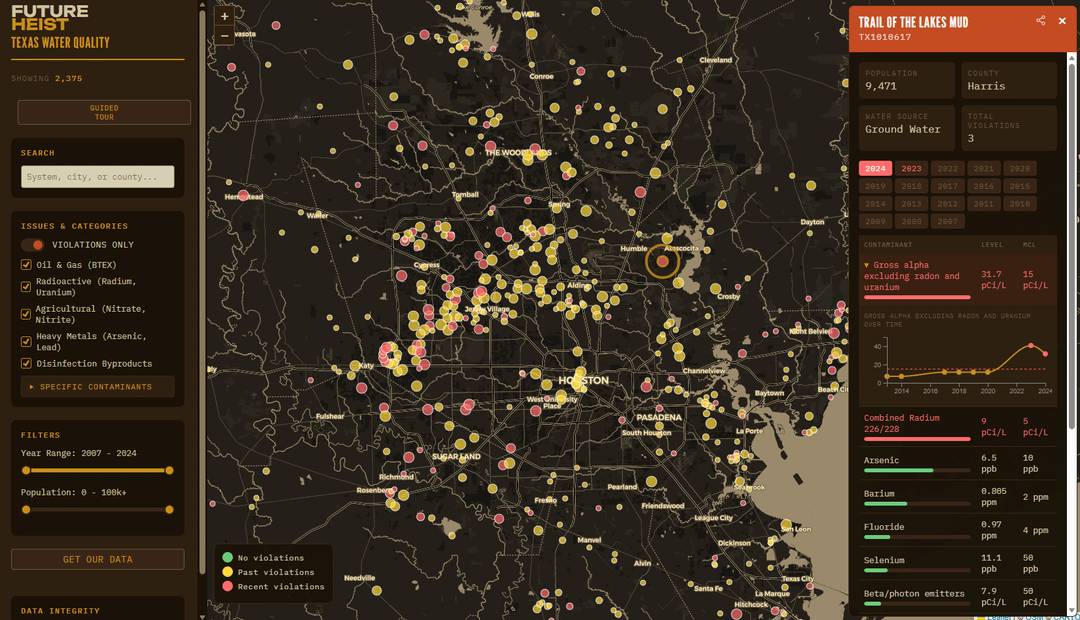
I extracted and cleaned the data to create this interactive dashboard.
Visualization details:
- 14,903 water systems mapped
- 2,375 systems with violations
- 11.6 million people affected
Color coding:
- Green = no violations
- Yellow = past violations
- Red = recent violations
You can filter by contaminant type, year range, and population.
Data source: Texas Commission on Environmental Quality (TCEQ) public water system compliance reports (processed data available in a CSV — click the 'Get Our Data' link)
Tools used: Custom Python scraping/parsing scripts + Leaflet.js for the interactive map
by greg-randall