
Source: Office of Management and Budget Historical Table 3.2 (FY2027 Budget)
Visualization created in R with GGPLOT2
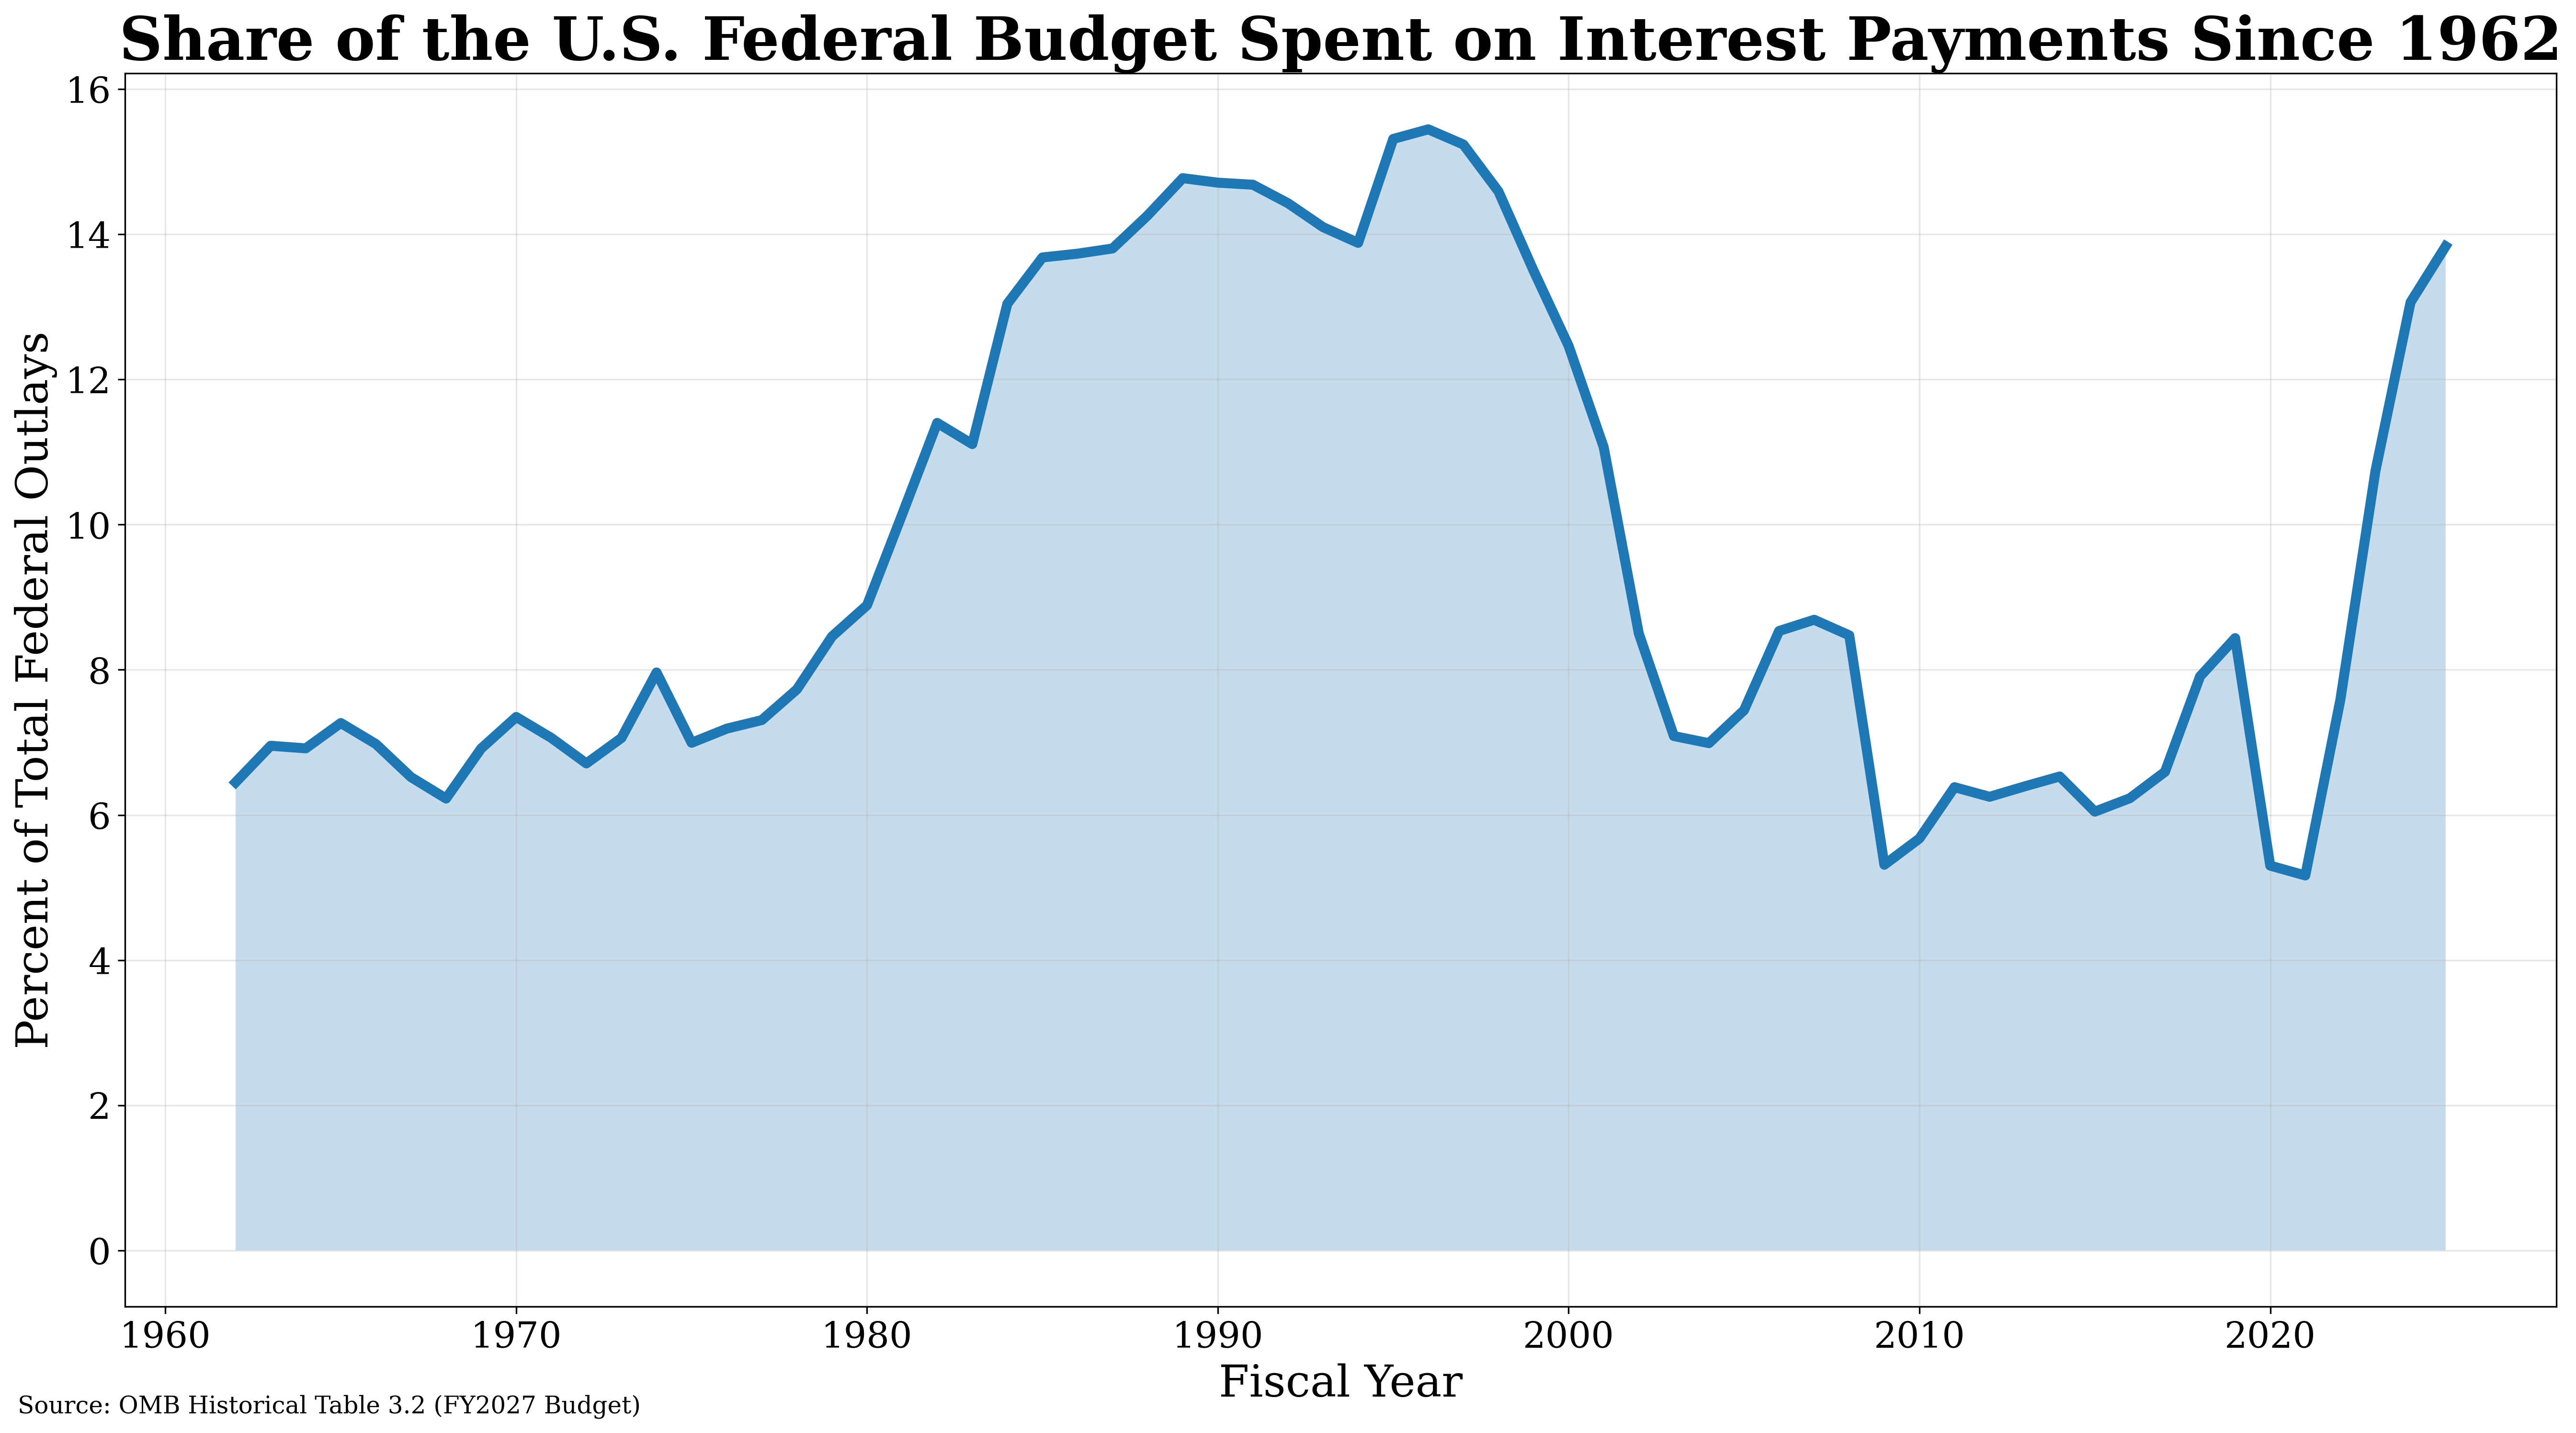
This chart shows net interest payments on the U.S. national debt as a share of total federal outlays from 1962–2025 using OMB historical budget data.
Interest costs consumed a large share of the federal budget during the high-interest-rate environment of the 1980s, fell during the post-2008 low-rate era, and have surged again following recent rate hikes and rapid debt growth.
We look forward to hearing your feedback
by forensiceconomics