
I created a stat that measures overall three point impact based on shot difficulty, accuracy, and volume. The details/source of the stat are here. The dataset is here.
There are 3,250 total qualifying player-seasons in this data set. All 12 of Stephen Curry's seasons are in the top 62. His worst season is in the 99.4th percentile.
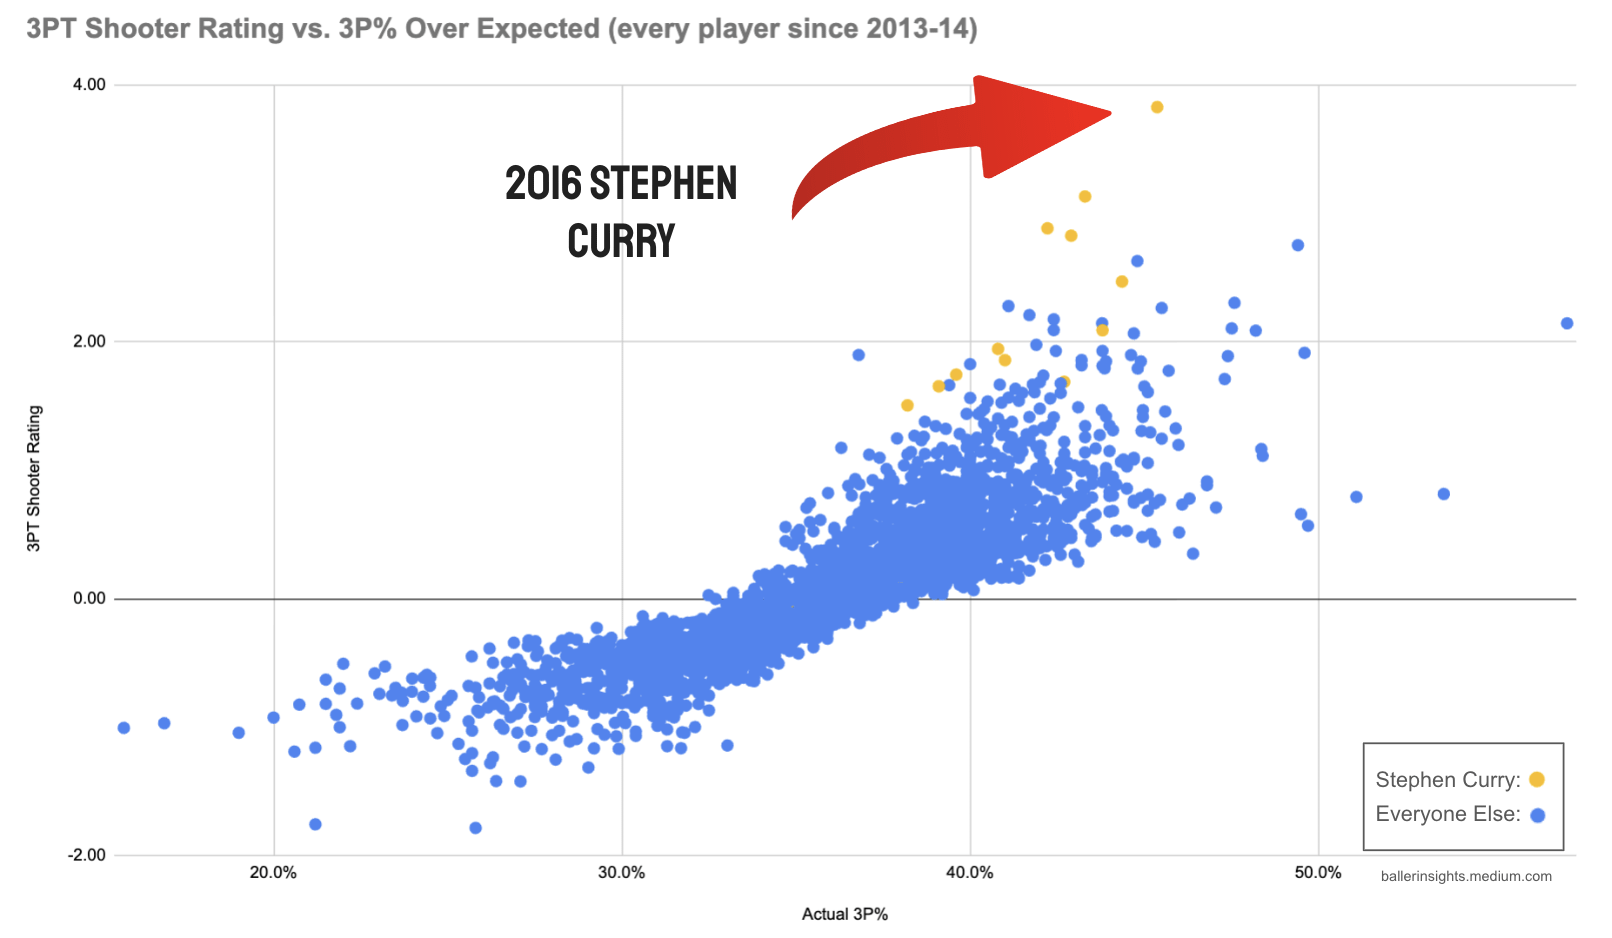
Stephen Curry owns the top 4 seasons and 5 of the top 7 seasons. Curry's 2016 season is 40% higher than the best non-Curry performance.
edit 1: In plain English, the 3 Point Shooter Rating (the stat on the y-axis) tells you how many extra points per game a shooter scores from threes compared to what their shot difficulty predicts.
edit 2: Type – The title of the graph should be 3PT Shooter Rating vs. Actual 3P%
by Jealous_Detective619
7 Comments
is this saying that someone has shot nearly 60% from 3 in a season?
Why do they get rewarded for taking more difficult shots?
Another variable to consider is difficulty of shot. Curry always has a two defenders looking at him. Many “3 point specialist” are often camped in the corner and just waiting for the ball for an open shot after a defensive breakdown.
Who is that season on the far right of the graph?
Would be curious to see where Kon is in here. And maybe a rookie season only version.
I wanna see Harden, Lillard and Klay Thompson dots too !
Might be some utility to incorporate something as simple as player height into the difficulty of their shot profile. Durant is a good example for how that dinension is being missed. For example, he is able to take, for him, “open” and routine jumpshots when the tracking data show defenders are close.
Does the source data have catch-and-shoot % as well? I know some shot tracking data has that, could be another interesting thing to include if able – would probably make Steph an even bigger outlier.