
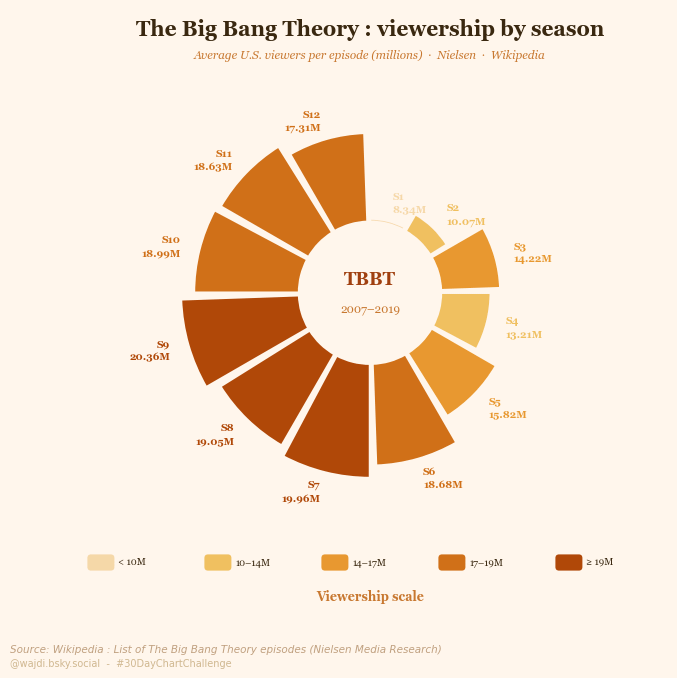
I built a radial petal chart of TBBT's viewership history. One arc per season, arc length scaled to average viewers per episode. Twelve arcs total, one for each season from 2007 to 2019.
The reason I chose this format over a standard bar chart is that the silhouette of the whole shape tells you something a bar chart doesn't. It bulges heavily on one side (seasons 6 through 11) and sits almost timid on the other (seasons 1 and 2). That asymmetry is the career arc of the show at a glance.
What I find most interesting in the data is the six-season plateau from S6 to S11, ranging between 18 and 20 million viewers. That kind of sustained dominance over six consecutive years is rare. Most hits spike and fall. This one just held.
Tools and data: Built in Python using matplotlib, specifically Wedge patches for the annular arcs. Data comes from Nielsen Media Research as reported on Wikipedia's episode list for the series and cross-referenced with Deadline.com figures via Statista. Color scale runs from pale amber for the smallest seasons to burnt orange for the peak years.
by wajdix
3 Comments
“It bulges heavily on one side (seasons 6 through 11) and sits almost timid on the other (seasons 1 and 2). That asymmetry is the career arc of the show at a glance.”
Doesn’t a bar chart also do this?
I don’t even know where to start. Bad
Two critiques:
1. Your scale is misleading. It is really showing the increase in viewership over the initial season since the initial season is scaled to 0. I would make it so that the 8 million viewers per episode appears to be roughly 40% of the 20 million, rather than appearing to be 0.
2. You use color and size to convey the same data. While redundancy isn’t always bad, it always makes me wonder if the author could show something else with color. For example, if you think there is something driving the season 6-11 dominance you describe (a character? A story arc? Etc) you could use color to show that and then your plot becomes twice as informative and makes a claim.
All together, not a bad idea. But unworkable with the scale as is.