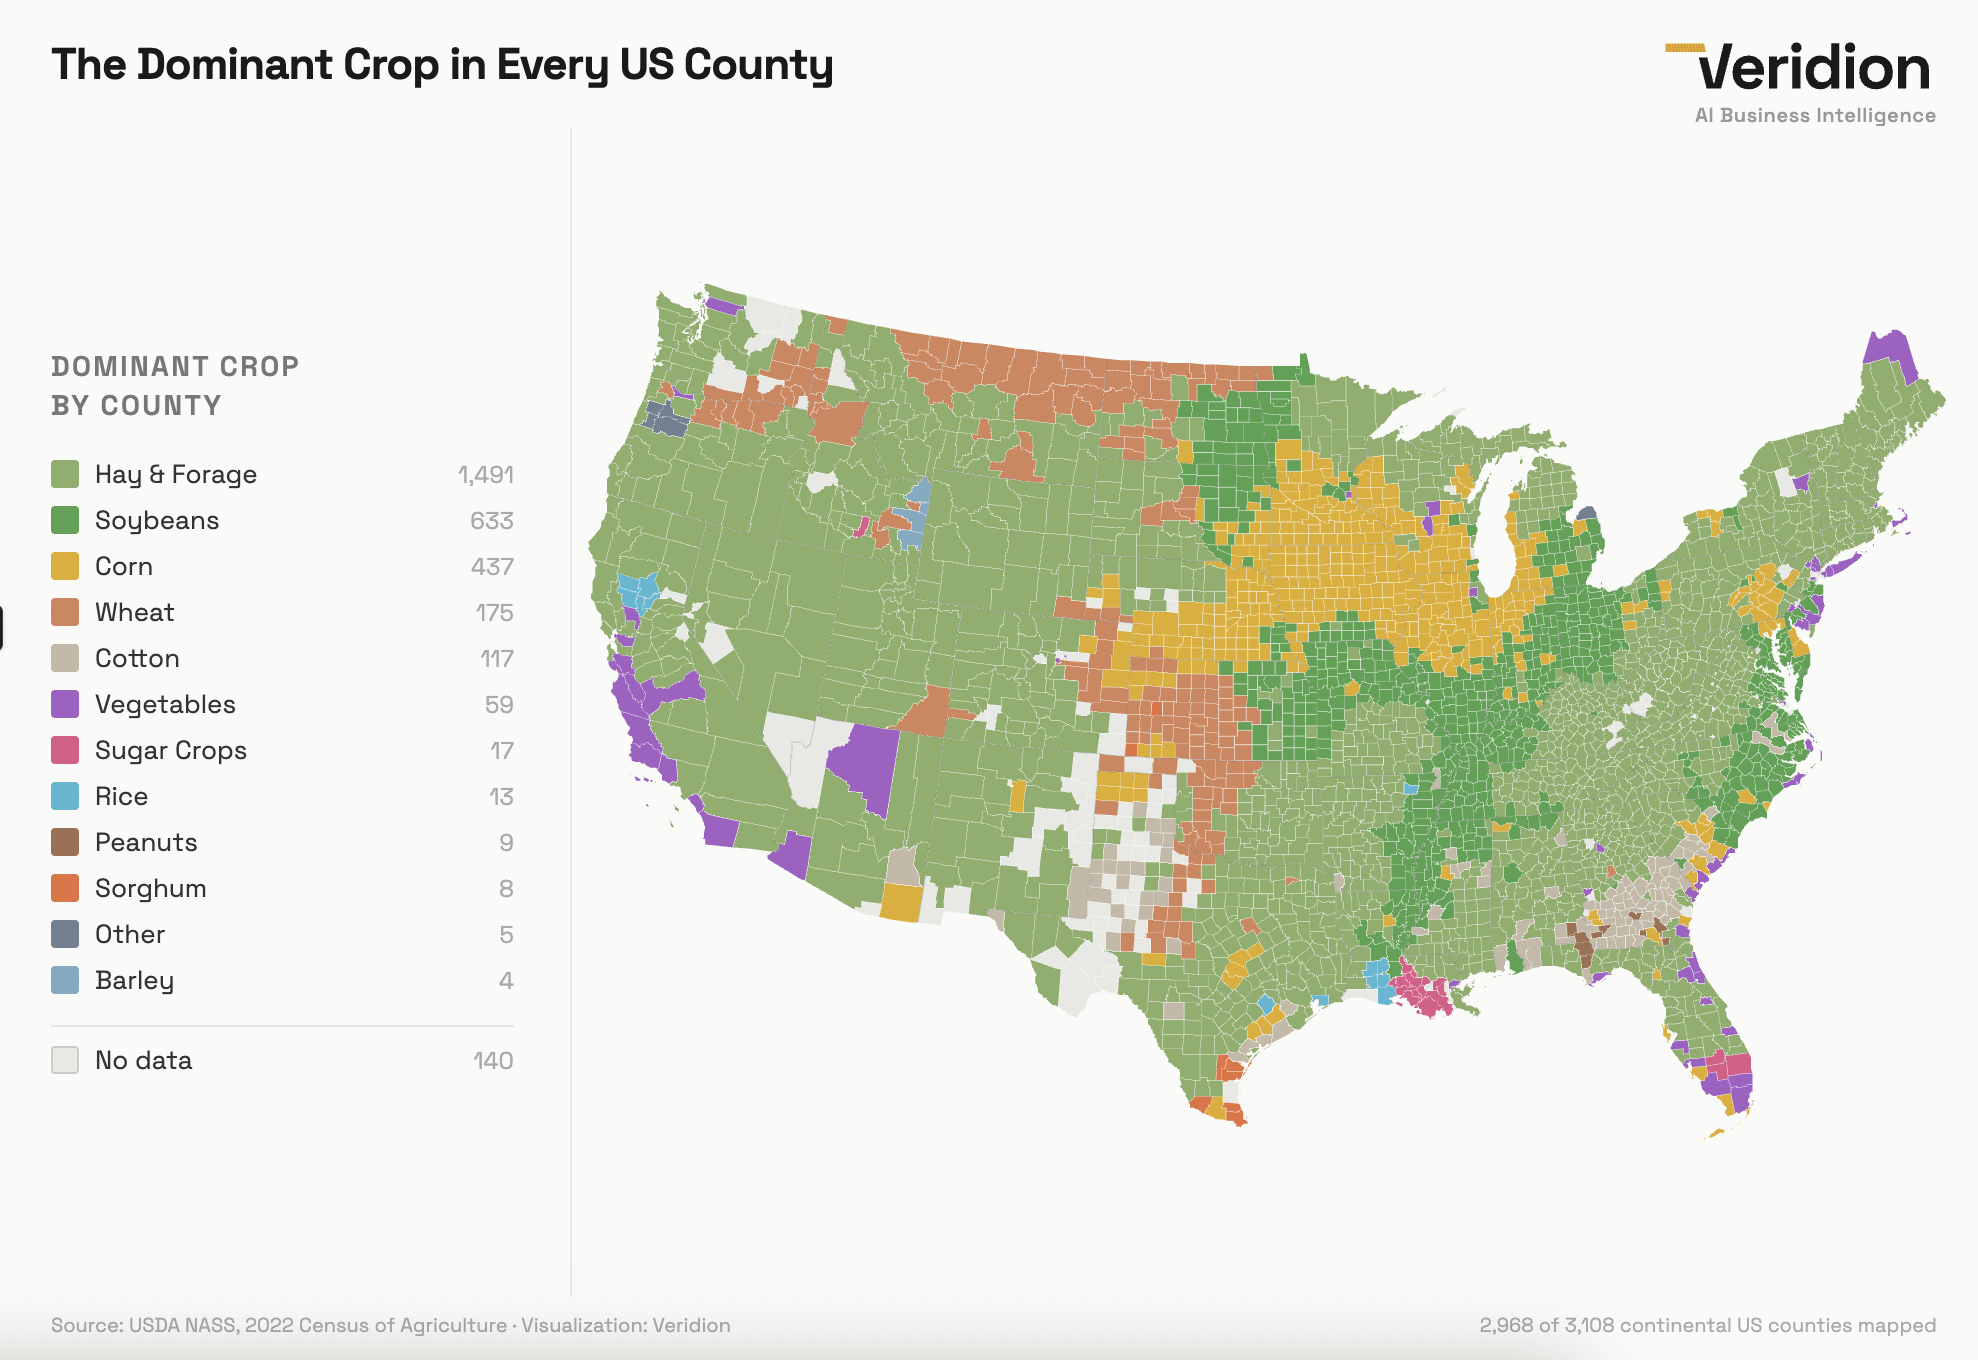
2,968 continental US counties colored by whichever crop takes the largest share of harvested cropland acreage. 22 crop categories compared per county.
Data: USDA NASS 2022 Census of Agriculture. Hay & Forage dominates half the map because most US agricultural land genuinely exists to feed livestock, not a data artifact. 140 counties with no usable crop data are mostly urban.
Tools: Python for data processing, Claude for visualization, Puppeteer for export. County boundaries from us-atlas TopoJSON. Veridion for supplementary business location data.
NathaNRiveraMelo on
I’d love to see this for the entire world
SubRoutine404 on
I want to see this map with lawns included
withak30 on
A little surprised to not see weed anywhere in NorCal, but I guess it can’t compete in acreage.
Llama_in_a_tux on
So what we’ve learned is that the meat industry is large
wagon_ear on
My one comment here is that in northern Wisconsin, the number one agricultural product is lumber.
It doesn’t show up under this definition of crop, but that entire area is virtually one solid forest, so I think it’s a bit misleading to portray “hay and forage” as being the dominant product of that region (and I’m sure this would apply to other areas like northern MN, VT, and ME as well).
[deleted] on
[deleted]
OPsDearOldMother on
I got curious and had to look it up. The corn grown in Santa Fe County is primarily used for livestock feed, so ultimately not too different from the hay & forage category.
I was thinking maybe it was local heirloom varieties of corn like blue corn but that seems to be a small percentage.
np8790 on
Seeing my almost 100% urbanized Florida county listed as “corn”…
pnw_203 on
Shout out filberts in Oregon!
MannyDantyla on
What is the measurement that makes one crop dominant over others? Is it number of acres planted, or is it a money thing, or something else?
I live in a green county (soy bean) but there’s many more corn fields from what I see.
NoBSforGma on
It’s amazing how much hay, forage and corn is grown compared to vegetables. And fruit not even listed! Tells you a lot about how much food is imported.
tugtrog on
In southwest Oklahoma it’s 100% cotton not wheat. But it is a very cool graph.
BrennusSokol on
Would be nice if grapes / wine were broken out specifically
Ok_Construction5119 on
By kg? By $? By bushel?
All in all, shit graphic
Edit: i see in comments you said it’s by acreage. I think that’s the worst possible measure but regardless it should be in the pic
non_standard_model on
The #1 crop is actually beef
IAmJustAVirus on
What the other in the tip of Michigan’s Thumb? I see mentions of corn, wheat, soy, dry beans. Cherries? Apples? Weed? Potato?
Low_Cut_368 on
I really like the fact these colours were chosen as sensibly as possible and actually kind of reflect what they represent
tht1guy63 on
Baldwin county alabama is soybeans? Huh. Never see them . Mobile ya theres not much farming there other than a little cotton for sure.
marigolds6 on
Not sure it is really feasible, but hay and forage should be separated. I’m also surprised that oil seeds are not a dominant crop in any of the counties bordering canada, are they being lumped into vegetables since they are often brassicas? Also surprised there are only 8 sorghum counties. (I also think a lot of those no data counties around texas might be cotton counties.)
Another criticism is that you really have to list the year(s) that this covers. Corn and soy, in particular, can readily shift from year to year.
Helicase21 on
This is going to vary a lot year by year especially in the great lakes region where farmers rotate corn and soybeans.
OldSchoolRNS on
Potatoes ( vegetables ) on Northern Maine but not Idaho? What’s up with that?
pandymen on
How is Napa county hay and forage instead of grapes?
vdub2625 on
Cape cod and Wisconsin, “vegetable” must include cranberries?
Lowfi-Concert on
I refuse to believe there’s not a single almond dominant County in the Central Valley
PMGeary on
We are making way too much soybeans
Affectionate-Map2583 on
I would think this would be more accurate if data over a span of years was used. For instance, in my county (including the field right behind my house), the crops are rotated every two years equally between corn and soybeans – 2 years of corn, 2 years of soybeans. My county shows up as soybeans here, but it’s right next to a corn county, and I think depending on which year it is, either one could fall into the other category.
slasher016 on
Vegetables as a category seems like a fail.
WeldAE on
For once, I have no notes on color choices. Don’t the rules of this sub require that all charts must only use slight variations of a single color on this sub? Most of the time I have to inspect the legend with photoshop just to read it. This goes WAY beyond that and the colors even make sense. I mean dirty white for the cotton bowl. Brown for peanuts. Yellow for corn was a softball, but still most others would have made it some shade of green. Future posters take notes.
Being from Iowa, today was the first day in my 53 years that I considered forage as a “crop type.” 😂
I belong to several Iowa gardening forums and new people that come to the state say, “what do I need to do to grow things in Iowa”. I usually say “just drop some seeds on the ground you can’t stop the stuff from growing here.” The only real challenge is keeping the weeds at bay.
specific78 on
I thought Colorado would be different for some reason 😂
Warm_Put_1759 on
Shout out to that one guy in Idaho growing sugar cane.
sexual_pasta on
I like the little section of sugar crops near Boise, that must be sugar beet.
lart2150 on
Where did Alaska and Hawaii go?
raleighviacal on
Napa county’s dominant crop is hay?
CodyBye on
How are thkey calculating dominant crop? By acreage? Money? Something else?
JRBeeler on
Who is growing vegetables in commercial quantities in Queens?
trucorsair on
Interesting that Tobacco is not listed, Kentucky and North Carolina would have had it as their cash crop only 20-40yrs ago.

40 Comments
2,968 continental US counties colored by whichever crop takes the largest share of harvested cropland acreage. 22 crop categories compared per county.
Data: USDA NASS 2022 Census of Agriculture. Hay & Forage dominates half the map because most US agricultural land genuinely exists to feed livestock, not a data artifact. 140 counties with no usable crop data are mostly urban.
Tools: Python for data processing, Claude for visualization, Puppeteer for export. County boundaries from us-atlas TopoJSON. Veridion for supplementary business location data.
I’d love to see this for the entire world
I want to see this map with lawns included
A little surprised to not see weed anywhere in NorCal, but I guess it can’t compete in acreage.
So what we’ve learned is that the meat industry is large
My one comment here is that in northern Wisconsin, the number one agricultural product is lumber.
It doesn’t show up under this definition of crop, but that entire area is virtually one solid forest, so I think it’s a bit misleading to portray “hay and forage” as being the dominant product of that region (and I’m sure this would apply to other areas like northern MN, VT, and ME as well).
[deleted]
I got curious and had to look it up. The corn grown in Santa Fe County is primarily used for livestock feed, so ultimately not too different from the hay & forage category.
I was thinking maybe it was local heirloom varieties of corn like blue corn but that seems to be a small percentage.
Seeing my almost 100% urbanized Florida county listed as “corn”…
Shout out filberts in Oregon!
What is the measurement that makes one crop dominant over others? Is it number of acres planted, or is it a money thing, or something else?
I live in a green county (soy bean) but there’s many more corn fields from what I see.
It’s amazing how much hay, forage and corn is grown compared to vegetables. And fruit not even listed! Tells you a lot about how much food is imported.
In southwest Oklahoma it’s 100% cotton not wheat. But it is a very cool graph.
Would be nice if grapes / wine were broken out specifically
By kg? By $? By bushel?
All in all, shit graphic
Edit: i see in comments you said it’s by acreage. I think that’s the worst possible measure but regardless it should be in the pic
The #1 crop is actually beef
What the other in the tip of Michigan’s Thumb? I see mentions of corn, wheat, soy, dry beans. Cherries? Apples? Weed? Potato?
I really like the fact these colours were chosen as sensibly as possible and actually kind of reflect what they represent
Baldwin county alabama is soybeans? Huh. Never see them . Mobile ya theres not much farming there other than a little cotton for sure.
Not sure it is really feasible, but hay and forage should be separated. I’m also surprised that oil seeds are not a dominant crop in any of the counties bordering canada, are they being lumped into vegetables since they are often brassicas? Also surprised there are only 8 sorghum counties. (I also think a lot of those no data counties around texas might be cotton counties.)
Another criticism is that you really have to list the year(s) that this covers. Corn and soy, in particular, can readily shift from year to year.
This is going to vary a lot year by year especially in the great lakes region where farmers rotate corn and soybeans.
Potatoes ( vegetables ) on Northern Maine but not Idaho? What’s up with that?
How is Napa county hay and forage instead of grapes?
Cape cod and Wisconsin, “vegetable” must include cranberries?
I refuse to believe there’s not a single almond dominant County in the Central Valley
We are making way too much soybeans
I would think this would be more accurate if data over a span of years was used. For instance, in my county (including the field right behind my house), the crops are rotated every two years equally between corn and soybeans – 2 years of corn, 2 years of soybeans. My county shows up as soybeans here, but it’s right next to a corn county, and I think depending on which year it is, either one could fall into the other category.
Vegetables as a category seems like a fail.
For once, I have no notes on color choices. Don’t the rules of this sub require that all charts must only use slight variations of a single color on this sub? Most of the time I have to inspect the legend with photoshop just to read it. This goes WAY beyond that and the colors even make sense. I mean dirty white for the cotton bowl. Brown for peanuts. Yellow for corn was a softball, but still most others would have made it some shade of green. Future posters take notes.
Do you not consider apples a crop?
60% of all apples grown in the US come from Washington. The county producing the most is Yakima county, which your map shows as grey.
[https://www.nass.usda.gov/Publications/AgCensus/2022/Online_Resources/County_Profiles/Washington/cp53077.pdf](https://www.nass.usda.gov/Publications/AgCensus/2022/Online_Resources/County_Profiles/Washington/cp53077.pdf)
Being from Iowa, today was the first day in my 53 years that I considered forage as a “crop type.” 😂
I belong to several Iowa gardening forums and new people that come to the state say, “what do I need to do to grow things in Iowa”. I usually say “just drop some seeds on the ground you can’t stop the stuff from growing here.” The only real challenge is keeping the weeds at bay.
I thought Colorado would be different for some reason 😂
Shout out to that one guy in Idaho growing sugar cane.
I like the little section of sugar crops near Boise, that must be sugar beet.
Where did Alaska and Hawaii go?
Napa county’s dominant crop is hay?
How are thkey calculating dominant crop? By acreage? Money? Something else?
Who is growing vegetables in commercial quantities in Queens?
Interesting that Tobacco is not listed, Kentucky and North Carolina would have had it as their cash crop only 20-40yrs ago.
I’m surprised tobacco isn’t bigger