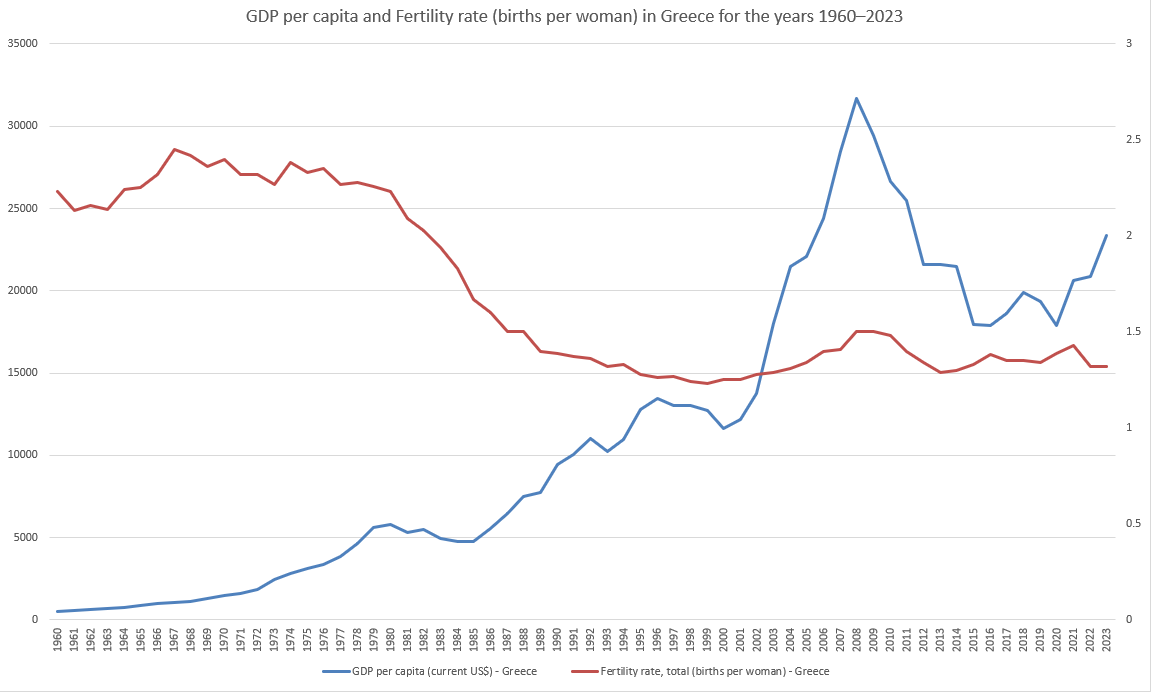
The fascinating thing is if I break it down into rough piecewise functions.
* 1960-79: a geometric growth in GDP per capita seems to correlate with a fertility rate that averages pretty flat.
* 1979-85: GDP plateaus, even backslides, and we see a precipitous fall in fertility.
* 1985-96: GDP climbs a lot, but fertility slightly decreases, but is just the first part in a larger fertility plateau.
* 1996-00: GDP backslides and fertility stabilizes in the middle part of the larger plateau.
* 2000-08: GDP per capita has a meteoric rise, yet fertility actually has a slight increase, wrapping up the average for the larger fertility plateau.
* 2008-15: GDP colapses and we see a slight fertility drop. (From the last section to this one, there may even be a slightly positive relation).
* 2015-20: We see a GDP all over the place, but it averages pretty flat, and we also see flat fertility trend (maybe a light inverse relation).
* 2020-23: We see GDP per capita climbing again and fertility starting to lose ground again.
Contrary to conventional wisdom, I’m not seeing a strong connection between GDP per capita and fertility at all. I feel like I am looking at an unplotted third factor.
Apple_Turnover93 on
Wow, almost 30000 births per women in the 1960s, how did they find the time

2 Comments
The fascinating thing is if I break it down into rough piecewise functions.
* 1960-79: a geometric growth in GDP per capita seems to correlate with a fertility rate that averages pretty flat.
* 1979-85: GDP plateaus, even backslides, and we see a precipitous fall in fertility.
* 1985-96: GDP climbs a lot, but fertility slightly decreases, but is just the first part in a larger fertility plateau.
* 1996-00: GDP backslides and fertility stabilizes in the middle part of the larger plateau.
* 2000-08: GDP per capita has a meteoric rise, yet fertility actually has a slight increase, wrapping up the average for the larger fertility plateau.
* 2008-15: GDP colapses and we see a slight fertility drop. (From the last section to this one, there may even be a slightly positive relation).
* 2015-20: We see a GDP all over the place, but it averages pretty flat, and we also see flat fertility trend (maybe a light inverse relation).
* 2020-23: We see GDP per capita climbing again and fertility starting to lose ground again.
Contrary to conventional wisdom, I’m not seeing a strong connection between GDP per capita and fertility at all. I feel like I am looking at an unplotted third factor.
Wow, almost 30000 births per women in the 1960s, how did they find the time