
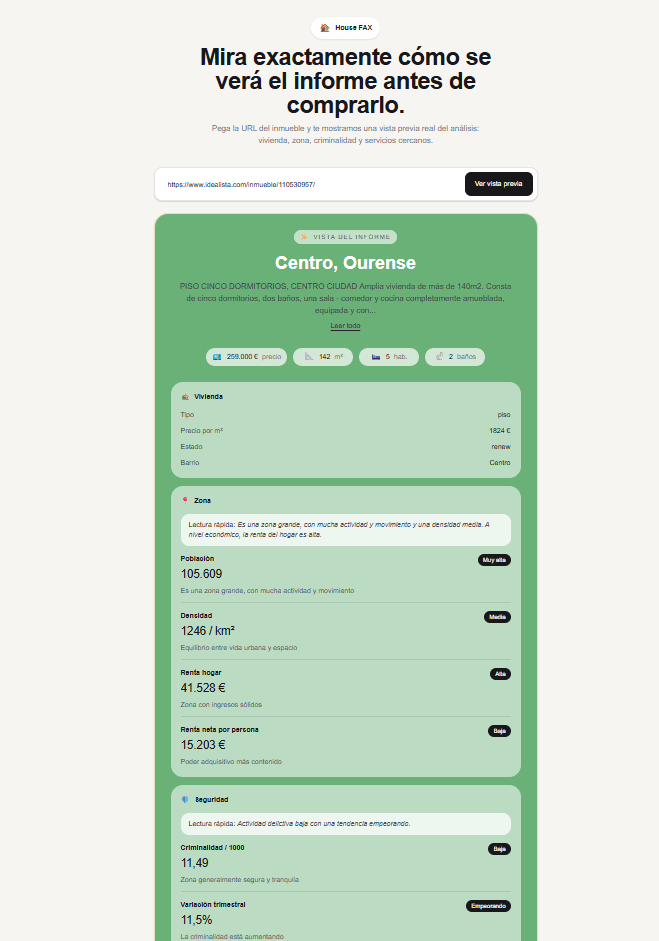
This visualization shows a breakdown of a residential property in Spain, combining listing data with public datasets.
Data included:
- Price per m² compared to nearby listings
- Average income in the area
- Crime indicators (estimated from nearby municipalities where necessary)
- Population trends
- Nationality distribution
The goal is to provide additional context beyond the listing price.
Data sources:
- Idealista (listing data)
- INE (Instituto Nacional de Estadística)
- Spanish cadastral data
- Public crime statistics (aggregated at municipality level)
Tools used:
- Custom data aggregation (TypeScript / API integrations)
- Data normalization and comparison models
Let me know if anything looks misleading or if you’d interpret this property differently.
by andresbasur98