Close Menu
    @usluck
    USLUCK
    @usluck
    USLUCK
    Home»Data Is Beautiful»[OC] Life expectancy increased across all countries of the world between 1960 and 2020 — an interactive d3 version of the slope plot
    Data Is Beautiful

    [OC] Life expectancy increased across all countries of the world between 1960 and 2020 — an interactive d3 version of the slope plot

    April 5, 2026


    INTERACTIVE PLOT: https://ikashnitsky.phd/x/d3/05-experimental.html
    Tools: R, d3, perplexity
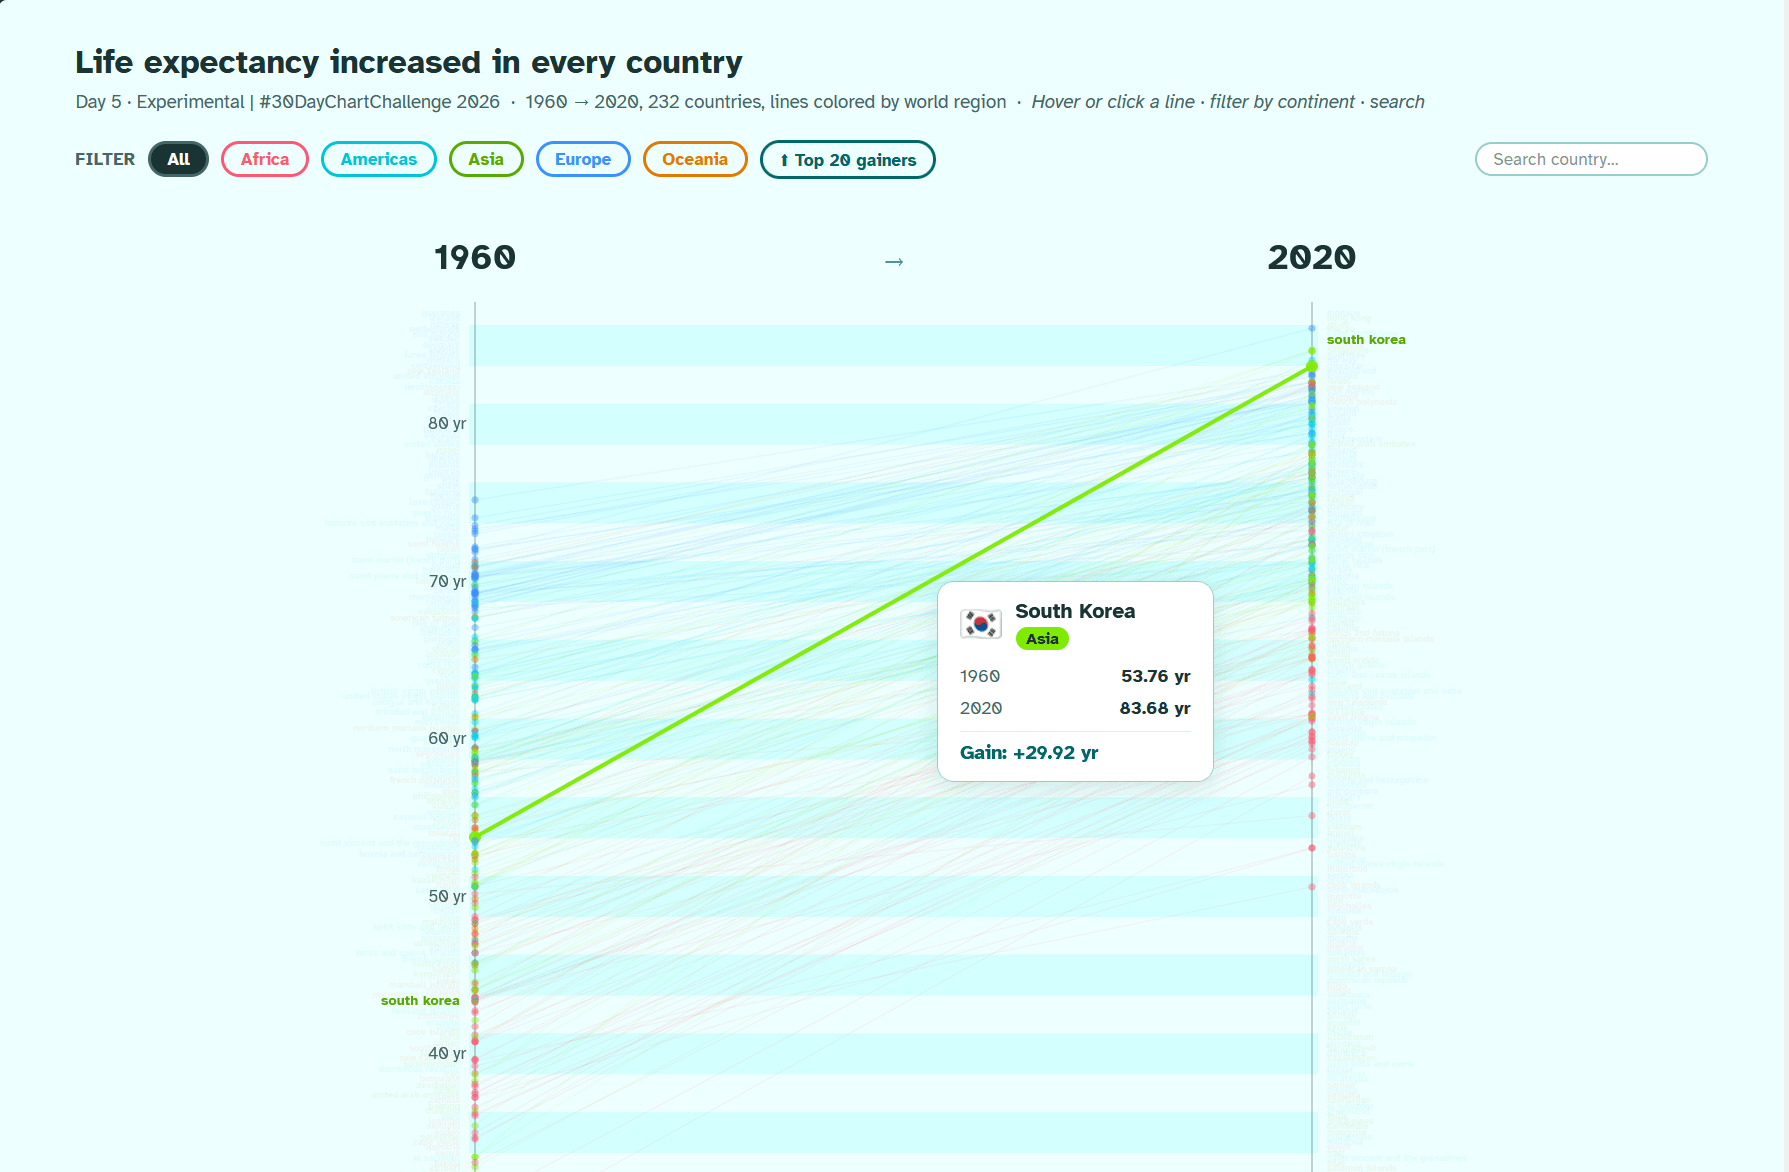
    Data: Our World in Data
    R code: https://github.com/ikashnitsky/30daychart2026/blob/main/src/05-experimental.r
    Perplexity chat: https://www.perplexity.ai/search/day-5-experimental-for-today-i-ldYZ2qw3Q3qBmwhhF902CQ

    by ikashnitsky

    Add A Comment
    Leave A Reply

    You must be logged in to post a comment.

    © 2026 USLUCK

    Type above and press Enter to search. Press Esc to cancel.