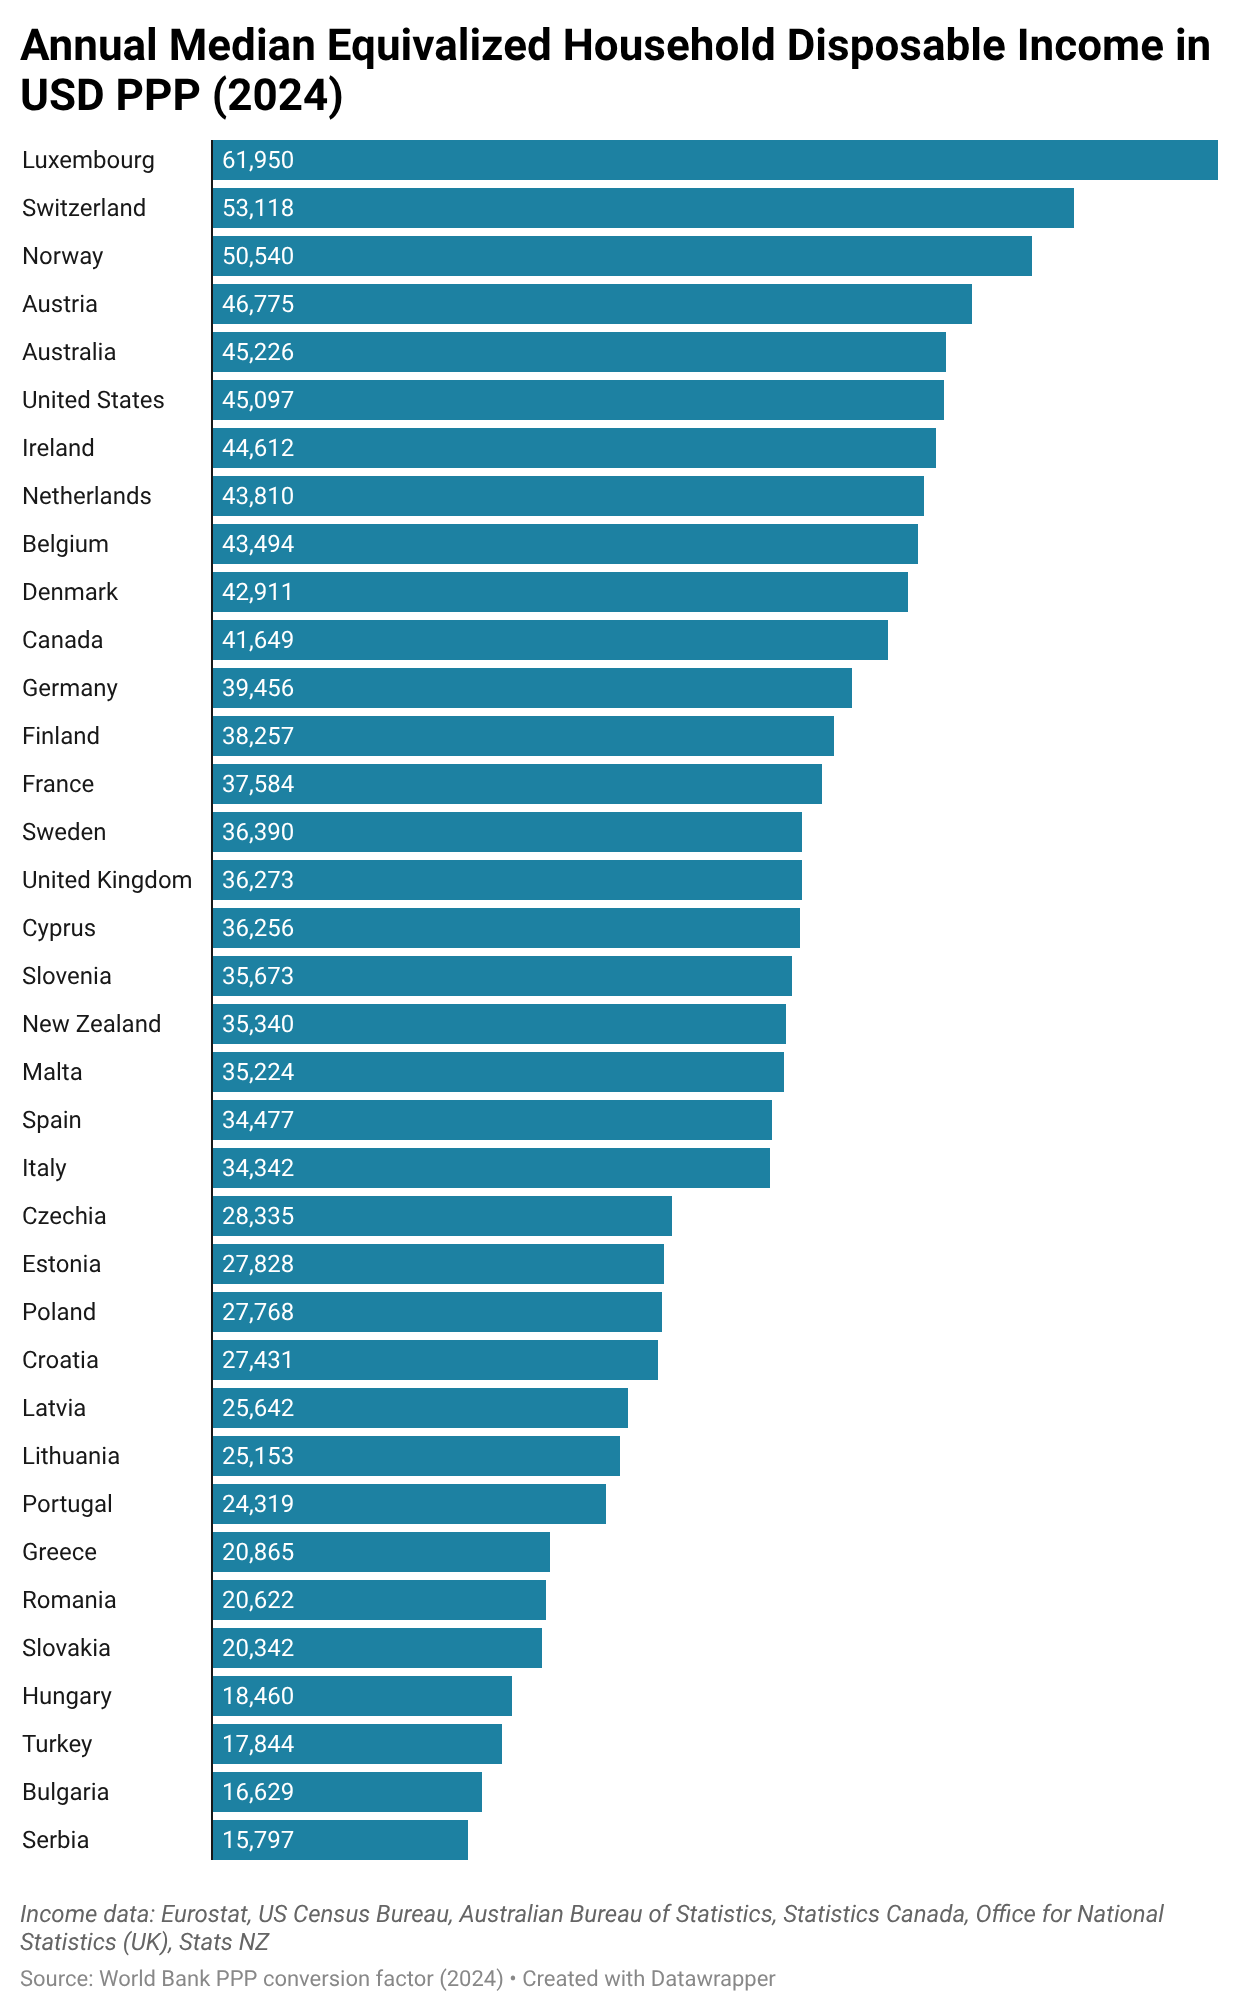
Equivalized income figures are not directly available for the US, the UK, and Canada; instead, they are estimated by dividing median disposable household income by the square root of household size, a simplified approach also used by the OECD. Canada is the only country in the chart for which 2023 data is used.
All income figures are sourced directly in national currencies and converted using purchasing power parity (PPP) conversion factors from the [World Bank](https://data.worldbank.org/indicator/PA.NUS.PPP). The Bulgarian figure was divided by 2 to account for discrepancy between EUR and BGN.
NeedToProgram on
Australia is kind of shocking to me. I figured they’d be closer to the UK’s
But my only real exposure is from hearing how expensive computer parts get there.
BasedInMunchen on
Can someone explain why Austria is sometimes in the top 5 for some things but sometimes doesn’t even make the top 15 for others?
Like in this Austria is top 5 but if you changed it to gdp per capita for eu countries I don’t think it makes top 5.
Same for happiness index, I feel like it doesn’t make top 10 but Wien is consistently in the top cities to live
Same for things like housing affordability and other stuff, I feel like it’s sometimes good and sometimes terrible depending on the metric
It’s not like Germany or Switzerland, which consistently performs well every time

3 Comments
The chart covers all countries with median income data from [Eurostat](https://ec.europa.eu/eurostat/databrowser/view/ilc_di03__custom_18724193/default/table), along with the core Anglosphere (US, UK, Canada, Australia, and New Zealand). The methodology is consistent with the [2021 OECD chart](https://www.oecd.org/en/publications/society-at-a-glance-2024_918d8db3-en/full-report/household-income_3ee61044.html#title-b344384343), updated with the latest available data.
Equivalized income figures are not directly available for the US, the UK, and Canada; instead, they are estimated by dividing median disposable household income by the square root of household size, a simplified approach also used by the OECD. Canada is the only country in the chart for which 2023 data is used.
All income figures are sourced directly in national currencies and converted using purchasing power parity (PPP) conversion factors from the [World Bank](https://data.worldbank.org/indicator/PA.NUS.PPP). The Bulgarian figure was divided by 2 to account for discrepancy between EUR and BGN.
Australia is kind of shocking to me. I figured they’d be closer to the UK’s
But my only real exposure is from hearing how expensive computer parts get there.
Can someone explain why Austria is sometimes in the top 5 for some things but sometimes doesn’t even make the top 15 for others?
Like in this Austria is top 5 but if you changed it to gdp per capita for eu countries I don’t think it makes top 5.
Same for happiness index, I feel like it doesn’t make top 10 but Wien is consistently in the top cities to live
Same for things like housing affordability and other stuff, I feel like it’s sometimes good and sometimes terrible depending on the metric
It’s not like Germany or Switzerland, which consistently performs well every time