[OC] U.S. elections: Winners aren’t majorities — most of the electorate doesn’t vote
(1932-2024)
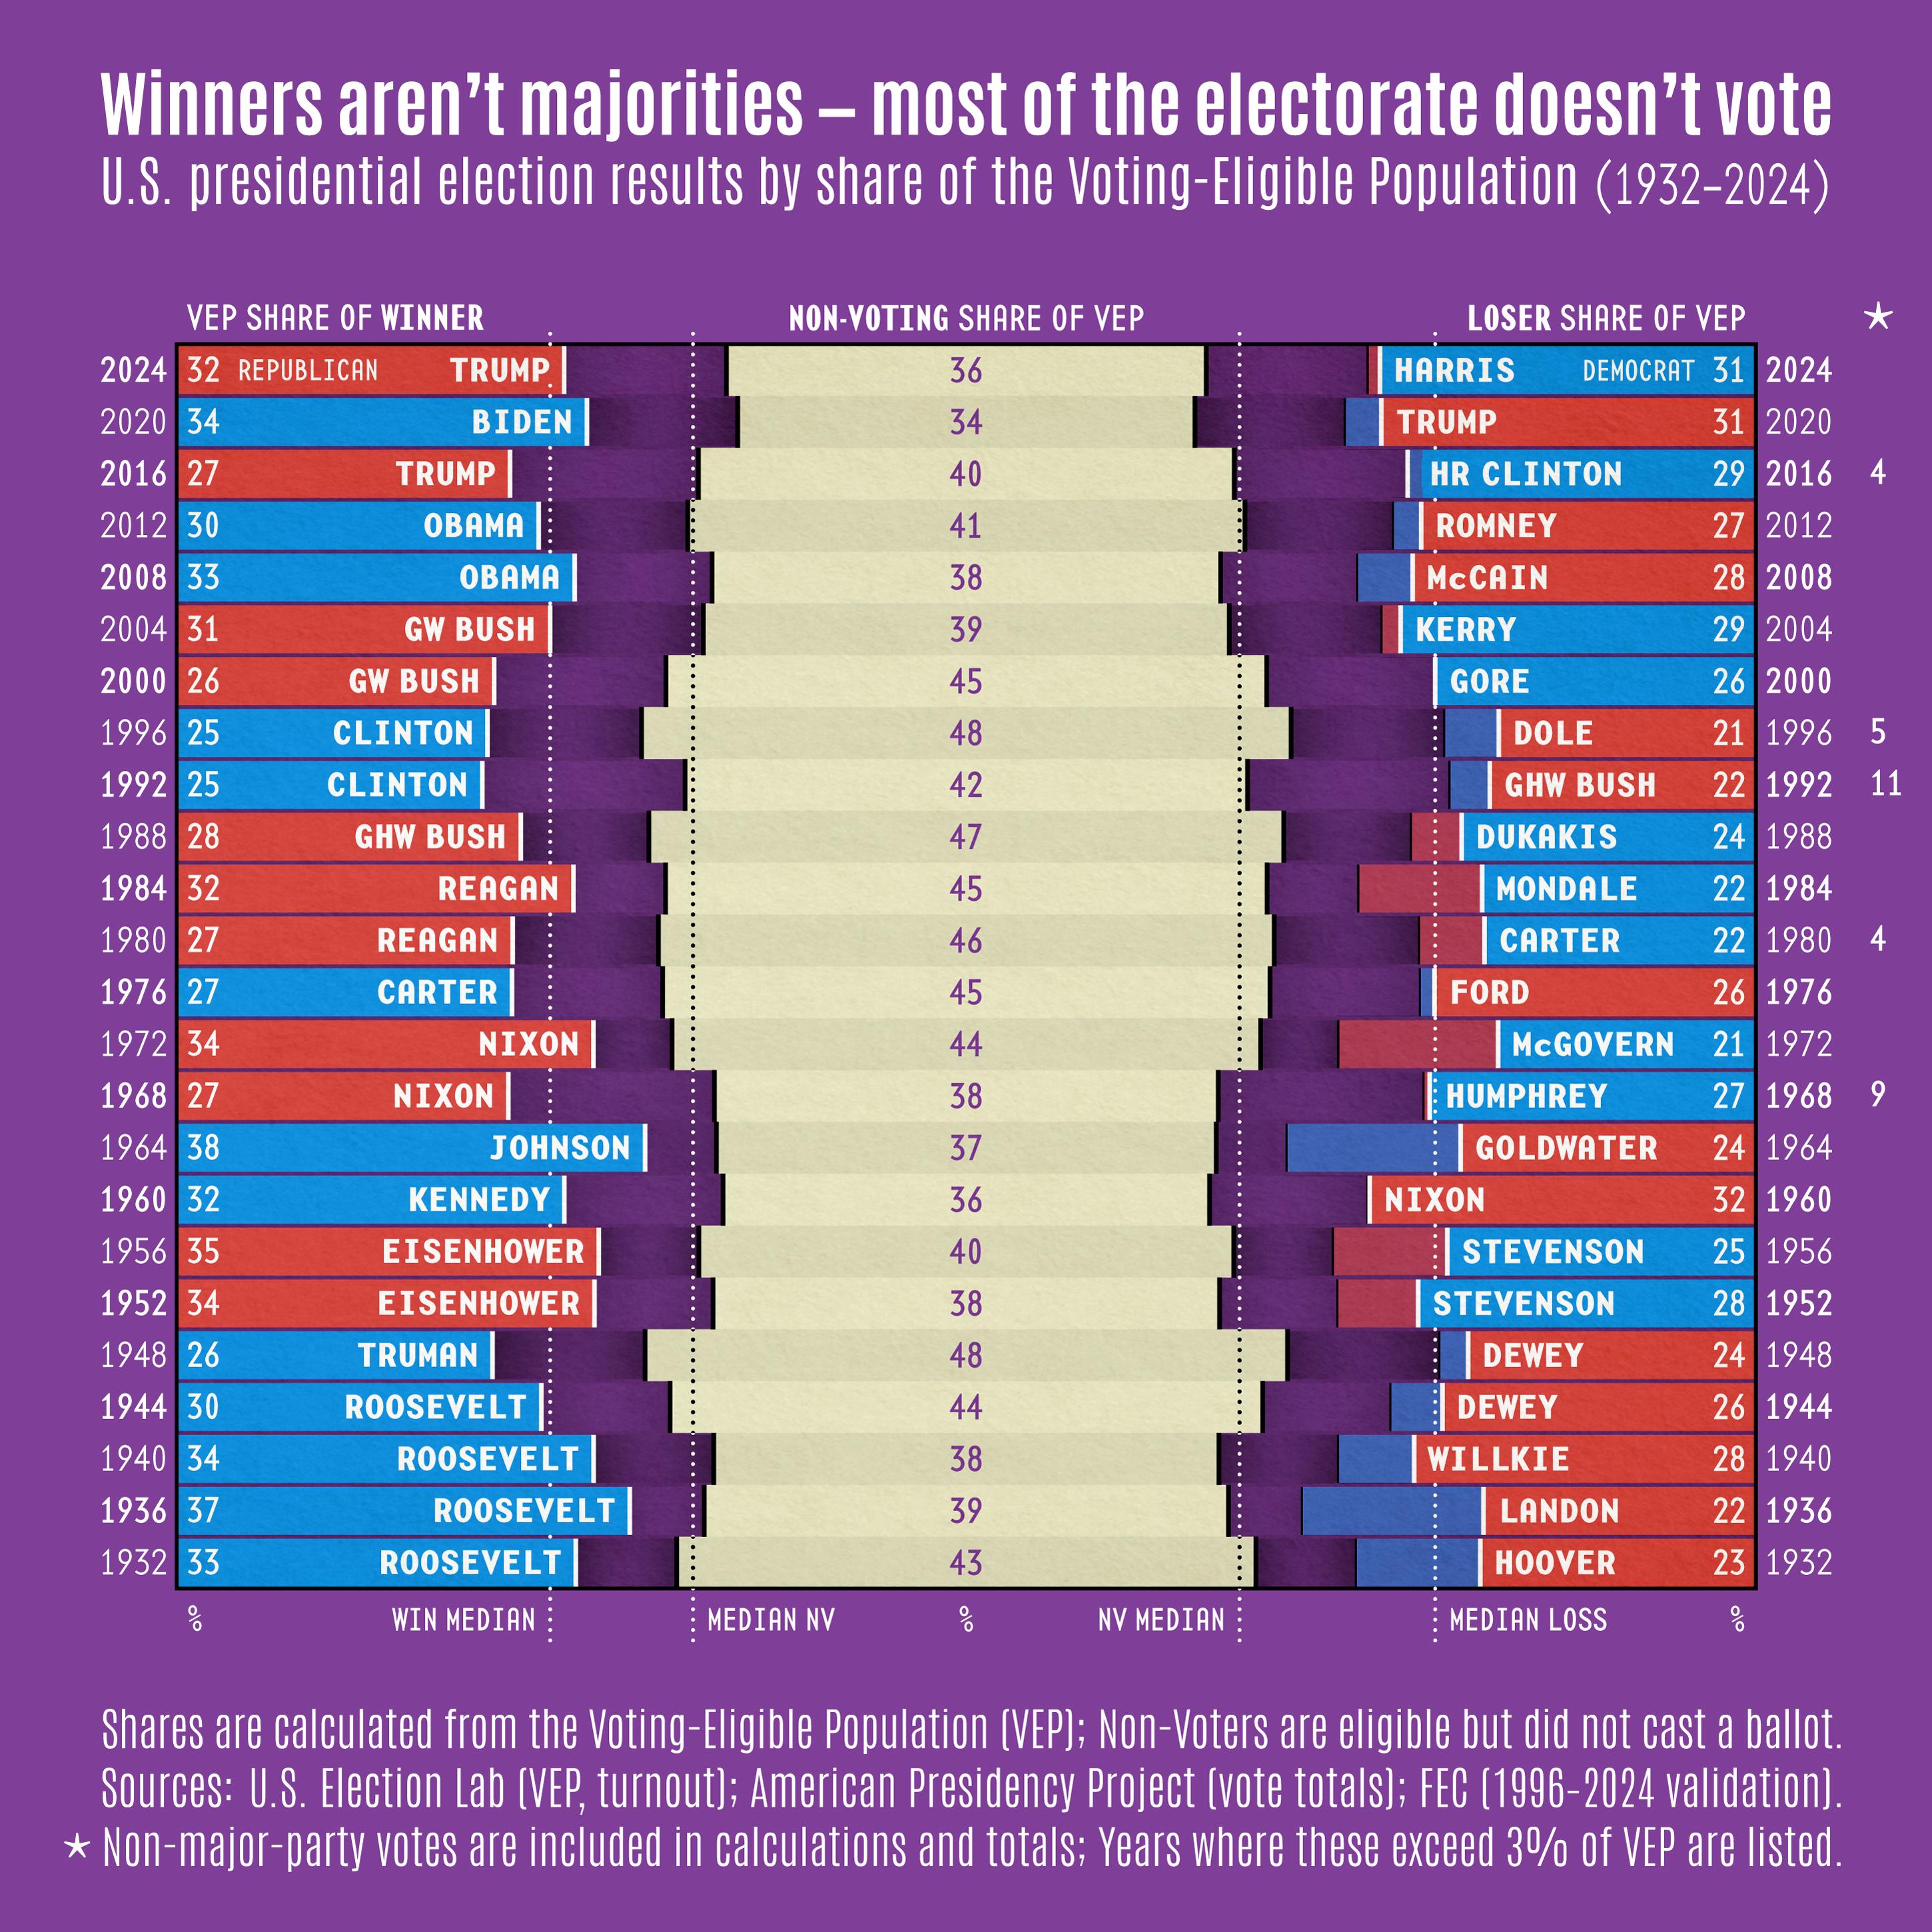
This chart shows U.S. presidential elections from 1932–2024 as shares of the Voting-Eligible Population (VEP), separating the electorate into three groups: the winning candidate, the losing candidate, and those who did not vote. Each row represents a single election year, with winners shown to the left, losers to the right, and non-voters centered as a mirrored bar. The layout emphasizes the relative size of each group within the full eligible population rather than within ballots cast, making clear how electoral outcomes relate to overall participation.
Regarding the use of the word, “**most**”: The chart shows that non-voters are consistently the largest single group within the eligible population, typically around 40–45%, exceeding both the winner and the loser individually.
The chart is designed to shift perspective from vote margins among participants to the broader composition of the electorate. By placing non-voters alongside winners and losers on the same scale, it highlights how often the largest share of eligible citizens does not participate and how winning candidates typically represent a minority of the total eligible population. The goal is not to make a causal claim, but to provide a clearer baseline for understanding the scale and context of electoral outcomes.
—
**Methodology**
Shares are calculated using the Voting-Eligible Population (VEP) as the denominator, with total ballots cast and VEP sourced from the U.S. Election Lab and major-party vote totals from the American Presidency Project, with Federal Election Commission data used to validate recent elections (1996–2024). Winner and loser shares reflect the Democratic and Republican nominees based on Electoral College outcomes. Non-voters are defined as the portion of the VEP that did not cast a ballot. Third-party votes are included in total turnout calculations but excluded from the visual display; years in which third-party candidates exceeded 3% of VEP are noted separately.
Shares are calculated as a percentage of the Voting-Eligible Population (VEP). Third-party votes are excluded from the visualization but accounted for in calculations. Non-voters are defined as the remainder of the VEP after all ballots cast.
I like this graph. Lots of information, presented in a meaningful way. Thanks.
soundisloud on
Interesting but what are the purple portions in each row? To the right and left of the non-voting block.
Zealousideal_Let_975 on
Non-voters need as much flack as Trump voters imo. Like what on earth is wrong with you.
Relikar on
Isn’t saying “Most of the electorate doesn’t vote” disingenuous when, in 2024 for example, 36% didn’t vote but 63% did?
Poland-lithuania1 on
Whenever I hear this, I wonder what would be such a graph for elections in countries which have multiple parties, so even with higher turnout no party might win a plurality of the vote when non-voters are counted as a singular bloc. Also for countries where even if two parties are easily the most popular, they still do not get the numbers the two main parties get in the US.
SamkonTheMankon on
It is very unclear what you are trying to show with the partially filled purple bars that sometimes have red + blue towards the middle.
DrumsKing on
Interesting how most of the “non voting” hung around 40 or so up until Trump won. Then it dropped to the low-mid 30’s. The last time it was that low was Kennedy. And we know what happened then.
JimBeam823 on
Biden was the only President to beat “Did not vote” (barely).
skawn on
Might be interesting if the US were to adopt Australia’s system where everyone eligible is required by law to vote, even if their vote is cast for no one.
ghost_desu on
And that’s why campaigns that focus on appealing to the other side always fail. You appeal to the median to get people who otherwise wouldn’t care to vote.
jrralls on
Curious about the methodology: Does the pre-1965 figures include African-Americans who were legally bared from voting or not?
kenlasalle on
You claim that “most don’t vote” and, yet, for every year on your chart the non-voting percentage is never over 50%…
TheRainOfPain on
Are Americans living abroad who don’t vote counted as well?
Darrothan on
Cool concept but halves the visual impact of the NV chart since it needs to expand evenly on both sides vs just one side.
B3ansb3ansb3ans on
If you don’t vote that just means that you are OK with whoever who gets in power.
Accomplished-Rest-89 on
Need to show electorate college
Share of population is not even guaranteed to be US citizens
salsalunchbox on
Interesting that the Bush boys are called out with initials each, even though they are very similar initials and the timeline makes it clear which Bush election, however with the two Clintons only Hilary has initials to differentiate. It’s giving that the Bushes are distinct but the Clintons are basically THE Clinton and then Clinton 2.
onwo on
I’d be willing to bet a large portion of this would change if the electoral college was done away with. For every state that’s not a swing state, it’s a pretty much foregone conclusion. If everyone’s vote individually mattered, it would get more folks out.
lmxbftw on
If you’re open to feedback, the purple regions make this extremely confusing to read.
annnnn5 on
If you don’t vote, you have no right to complain.
thenikolaka on
If we want 3rd parties and beyond in this country- institute a mandatory vote, like Australia. If you elect not to vote you pay a small fine, which would be able to help offset costs also.
There will be viable additional parties the very first election.
dr_jigsaw on
Yes! This looks great u/ptrdo!
funderfulfellow on
A two party system where a winner takes all is not a real democracy. It is inevitably bound for failure.
UrbanSurfDragon on
Not since Lyndon B Johnson has a President earned more votes than the non-voting electorate, and it appears he was the only one
therowdygent on
So basically getting 31% of the voting population is a guaranteed win?

26 Comments
[OC] U.S. elections: Winners aren’t majorities — most of the electorate doesn’t vote
(1932-2024)
This chart shows U.S. presidential elections from 1932–2024 as shares of the Voting-Eligible Population (VEP), separating the electorate into three groups: the winning candidate, the losing candidate, and those who did not vote. Each row represents a single election year, with winners shown to the left, losers to the right, and non-voters centered as a mirrored bar. The layout emphasizes the relative size of each group within the full eligible population rather than within ballots cast, making clear how electoral outcomes relate to overall participation.
Regarding the use of the word, “**most**”: The chart shows that non-voters are consistently the largest single group within the eligible population, typically around 40–45%, exceeding both the winner and the loser individually.
This chart is an iteration on a [previous post](https://www.reddit.com/r/dataisbeautiful/comments/1s4o4qy/oc_winning_losing_share_of_the_votingeligible/). Thanks for constructive comments there, and thanks to u/dr_jigsaw for the suggestion to combine the plots.
—
**Sources**
University of Florida Election Lab,
– 1980-2022 General Election Turnout Rates (v1.2):
– https://election.lab.ufl.edu/dataset/1980-2022-general-election-turnout-rates-v1-2/
University of Florida Election Lab,
– 2024 General Election Turnout Rates (v0.4)
– https://election.lab.ufl.edu/dataset/2024-general-election-turnout-rates-v0-4/
Federal Election Commission,
– Election results and voting information:
– https://www.fec.gov/introduction-campaign-finance/election-results-and-voting-information/
—
**Tools**
– MacOS Numbers (data prep)
– R (dplyr, ggplot2)
– Adobe Illustrator (final layout)
—
**Intent**
The chart is designed to shift perspective from vote margins among participants to the broader composition of the electorate. By placing non-voters alongside winners and losers on the same scale, it highlights how often the largest share of eligible citizens does not participate and how winning candidates typically represent a minority of the total eligible population. The goal is not to make a causal claim, but to provide a clearer baseline for understanding the scale and context of electoral outcomes.
—
**Methodology**
Shares are calculated using the Voting-Eligible Population (VEP) as the denominator, with total ballots cast and VEP sourced from the U.S. Election Lab and major-party vote totals from the American Presidency Project, with Federal Election Commission data used to validate recent elections (1996–2024). Winner and loser shares reflect the Democratic and Republican nominees based on Electoral College outcomes. Non-voters are defined as the portion of the VEP that did not cast a ballot. Third-party votes are included in total turnout calculations but excluded from the visual display; years in which third-party candidates exceeded 3% of VEP are noted separately.
Shares are calculated as a percentage of the Voting-Eligible Population (VEP). Third-party votes are excluded from the visualization but accounted for in calculations. Non-voters are defined as the remainder of the VEP after all ballots cast.
—
**Input Data**
| YEAR | VEP_POP | VOTES_TOTAL | VOTES_D | VOTES_R | EV_D | EV_R |
|——|———–|————-|———-|———-|——|——|
| 2024 | 243803423 | 156766239 | 75019230 | 77303568 | 226 | 312 |
| 2020 | 242077783 | 159738337 | 81268773 | 74216728 | 306 | 232 |
| 2016 | 230780798 | 138747904 | 65788564 | 62955340 | 232 | 306 |
| 2012 | 222437494 | 130231296 | 65899660 | 60932152 | 332 | 206 |
| 2008 | 213306165 | 132609063 | 69456897 | 59934814 | 365 | 173 |
| 2004 | 202972858 | 123535883 | 59028444 | 62040610 | 251 | 286 |
| 2000 | 194259660 | 107390107 | 50992335 | 50455156 | 266 | 271 |
| 1996 | 186327678 | 96277223 | 47402357 | 39198755 | 379 | 159 |
| 1992 | 179565711 | 104425014 | 44909326 | 39103882 | 370 | 168 |
| 1988 | 173609148 | 91594809 | 41809074 | 48886097 | 111 | 426 |
| 1984 | 167708463 | 92652842 | 37577185 | 54455075 | 13 | 525 |
| 1980 | 159690927 | 86513813 | 35483883 | 43904153 | 49 | 489 |
| 1976 | 148824615 | 81555889 | 40830763 | 39147793 | 297 | 240 |
| 1972 | 138289242 | 77718554 | 29170383 | 47169911 | 17 | 520 |
| 1968 | 117139000 | 73211875 | 31275166 | 31785480 | 191 | 301 |
| 1964 | 112491389 | 70644592 | 43129566 | 27178188 | 486 | 52 |
| 1960 | 107896895 | 68838219 | 34226731 | 34108157 | 303 | 219 |
| 1956 | 103034731 | 62026908 | 26022752 | 35590472 | 73 | 457 |
| 1952 | 98797621 | 61550918 | 27314992 | 33777945 | 89 | 442 |
| 1948 | 93278724 | 48691494 | 24105810 | 21970064 | 303 | 189 |
| 1944 | 85825886 | 47976670 | 25612610 | 22014160 | 432 | 99 |
| 1940 | 79835175 | 49817149 | 27243218 | 22334940 | 449 | 82 |
| 1936 | 74831133 | 45646991 | 27750866 | 16679683 | 523 | 8 |
| 1932 | 69855506 | 39747783 | 22818740 | 15760425 | 472 | 59 |
I like this graph. Lots of information, presented in a meaningful way. Thanks.
Interesting but what are the purple portions in each row? To the right and left of the non-voting block.
Non-voters need as much flack as Trump voters imo. Like what on earth is wrong with you.
Isn’t saying “Most of the electorate doesn’t vote” disingenuous when, in 2024 for example, 36% didn’t vote but 63% did?
Whenever I hear this, I wonder what would be such a graph for elections in countries which have multiple parties, so even with higher turnout no party might win a plurality of the vote when non-voters are counted as a singular bloc. Also for countries where even if two parties are easily the most popular, they still do not get the numbers the two main parties get in the US.
It is very unclear what you are trying to show with the partially filled purple bars that sometimes have red + blue towards the middle.
Interesting how most of the “non voting” hung around 40 or so up until Trump won. Then it dropped to the low-mid 30’s. The last time it was that low was Kennedy. And we know what happened then.
Biden was the only President to beat “Did not vote” (barely).
Might be interesting if the US were to adopt Australia’s system where everyone eligible is required by law to vote, even if their vote is cast for no one.
And that’s why campaigns that focus on appealing to the other side always fail. You appeal to the median to get people who otherwise wouldn’t care to vote.
Curious about the methodology: Does the pre-1965 figures include African-Americans who were legally bared from voting or not?
You claim that “most don’t vote” and, yet, for every year on your chart the non-voting percentage is never over 50%…
Are Americans living abroad who don’t vote counted as well?
Cool concept but halves the visual impact of the NV chart since it needs to expand evenly on both sides vs just one side.
If you don’t vote that just means that you are OK with whoever who gets in power.
Need to show electorate college
Share of population is not even guaranteed to be US citizens
Interesting that the Bush boys are called out with initials each, even though they are very similar initials and the timeline makes it clear which Bush election, however with the two Clintons only Hilary has initials to differentiate. It’s giving that the Bushes are distinct but the Clintons are basically THE Clinton and then Clinton 2.
I’d be willing to bet a large portion of this would change if the electoral college was done away with. For every state that’s not a swing state, it’s a pretty much foregone conclusion. If everyone’s vote individually mattered, it would get more folks out.
If you’re open to feedback, the purple regions make this extremely confusing to read.
If you don’t vote, you have no right to complain.
If we want 3rd parties and beyond in this country- institute a mandatory vote, like Australia. If you elect not to vote you pay a small fine, which would be able to help offset costs also.
There will be viable additional parties the very first election.
Yes! This looks great u/ptrdo!
A two party system where a winner takes all is not a real democracy. It is inevitably bound for failure.
Not since Lyndon B Johnson has a President earned more votes than the non-voting electorate, and it appears he was the only one
So basically getting 31% of the voting population is a guaranteed win?