
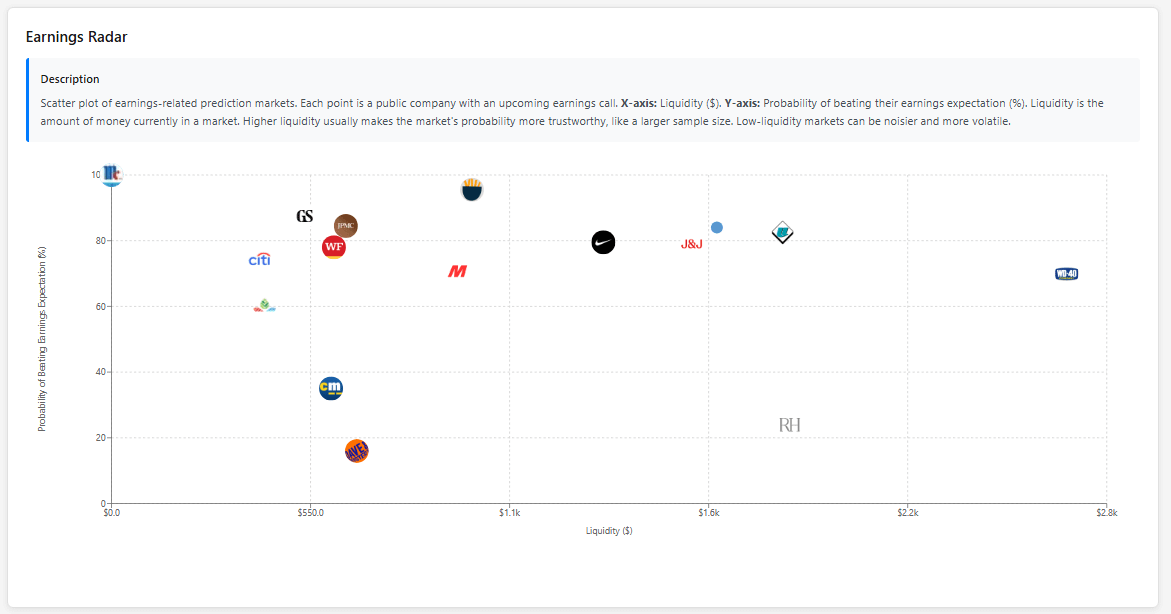
Scatter plot of earnings-related prediction markets. Each point is a public company with an upcoming earnings call. ($). Y-axis: Probability of beating their earnings expectation (%). X-axis: Liquidity. Liquidity is the amount of money currently in a market. Higher liquidity usually makes the market's probability more trustworthy, like a larger sample size. Low-liquidity markets can be noisier and more volatile.
by BadBoyBrando
1 Comment
Data Source: Polymarket API
Tools: Cursor, React (i think), ~vibecoded~