
Hi everyone! I’m 15, and I’ve been working on this data visualization project for a while. I wanted to connect planets not by their physical distance in space, but by their actual physical characteristics (mass, star type, discovery method, etc.).
I built a Python backend to fetch data from the NASA Exoplanet Archive, vectorized the features using Ollama, and pre-calculated the 3D coordinates in the background with NetworkX so the WebGL-based frontend doesn't freeze your browser.
I am completely open to any ideas and suggestions on how I can take this project further. I would love to hear your valuable advice to help me learn and improve myself in this field.
Source Code & Repo: https://github.com/pancodurden/astro-net
by avariabase0
12 Comments
Just a fair warning: People are gonna dogpile you for using an LLM. Even though it was used for an actually appropriate purpose here. Even though it was locally hosted. People have no nuance about the topic.
What does your age have to do with anything? Did you think you’d get extra little brownie points for it?
Are you one of us neurospicies but good? If yes, keep doing your thing.
Confused why you mention your age twice. Can’t find the relevance other than hoping for praise
Looks a new Path of Exile map update with a lot of scying done 😛
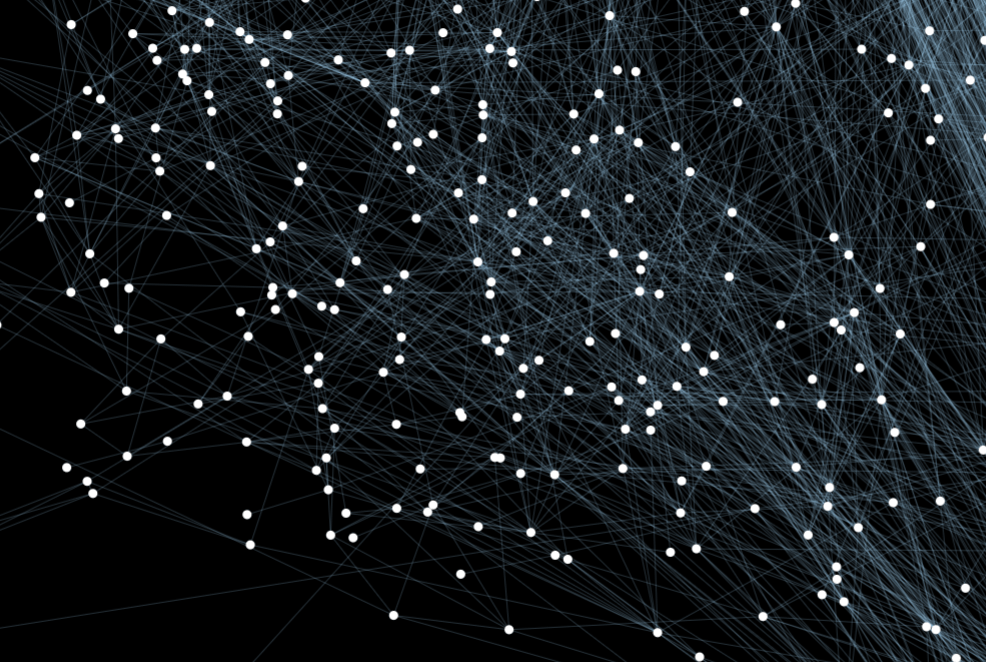
I can’t understand what I’m looking at at all and I’ve seen graphs showing expplanets organized by size mass distance from their star composition star type etc.
Seems like a really creative project with a lot of different parts to learn. Keep it up!
What am I looking at? For me, a good visualization should be conveying clear and concise information. Right now, even with your description of what you did, I could not extract any meaningful information about the exoplanets.
I’m confused why you call it an LLM when you aren’t using an LLM at all. Vector embeddings are something entirely different from an LLM. This project constructs a semantic similarity graph based on planets characteristics and doesn’t just use an LLM to “calculate” similarity.
Also it seems you have a 0.92 similarity threshold but the template:
f”Planet {pl_name} orbits star {hostname} of type {st_type}. Discovered in {discovery_year} using {method}” would give any two planets 85% similarity even if they shared nothing in common since the text string is similar.
I think the project is fine in theory but it would be a lot more meaningful to not use a text embedding model and instead create a similarity graph based on the planets actual data. Typically embedding models are used when the underlying data is text. Here since you have structured data it might be better to directly compare fields to each other.
Could you make any part clickable? Or on hover an exoplanet point displays info?
Okey, ngl this is cool… As a 33 year old senior engineer let me tell you this, man you have a gift at this, you might have had some help from an LLM and that’s fine, just the fact that you can think and understand this is pretty amazing!
The next logical step would be to categorize and build models that predict the likelihood of a system to have certain types of planets based on stellar composition and whatever else you might think as a variable.
Axis labels would be useful here