
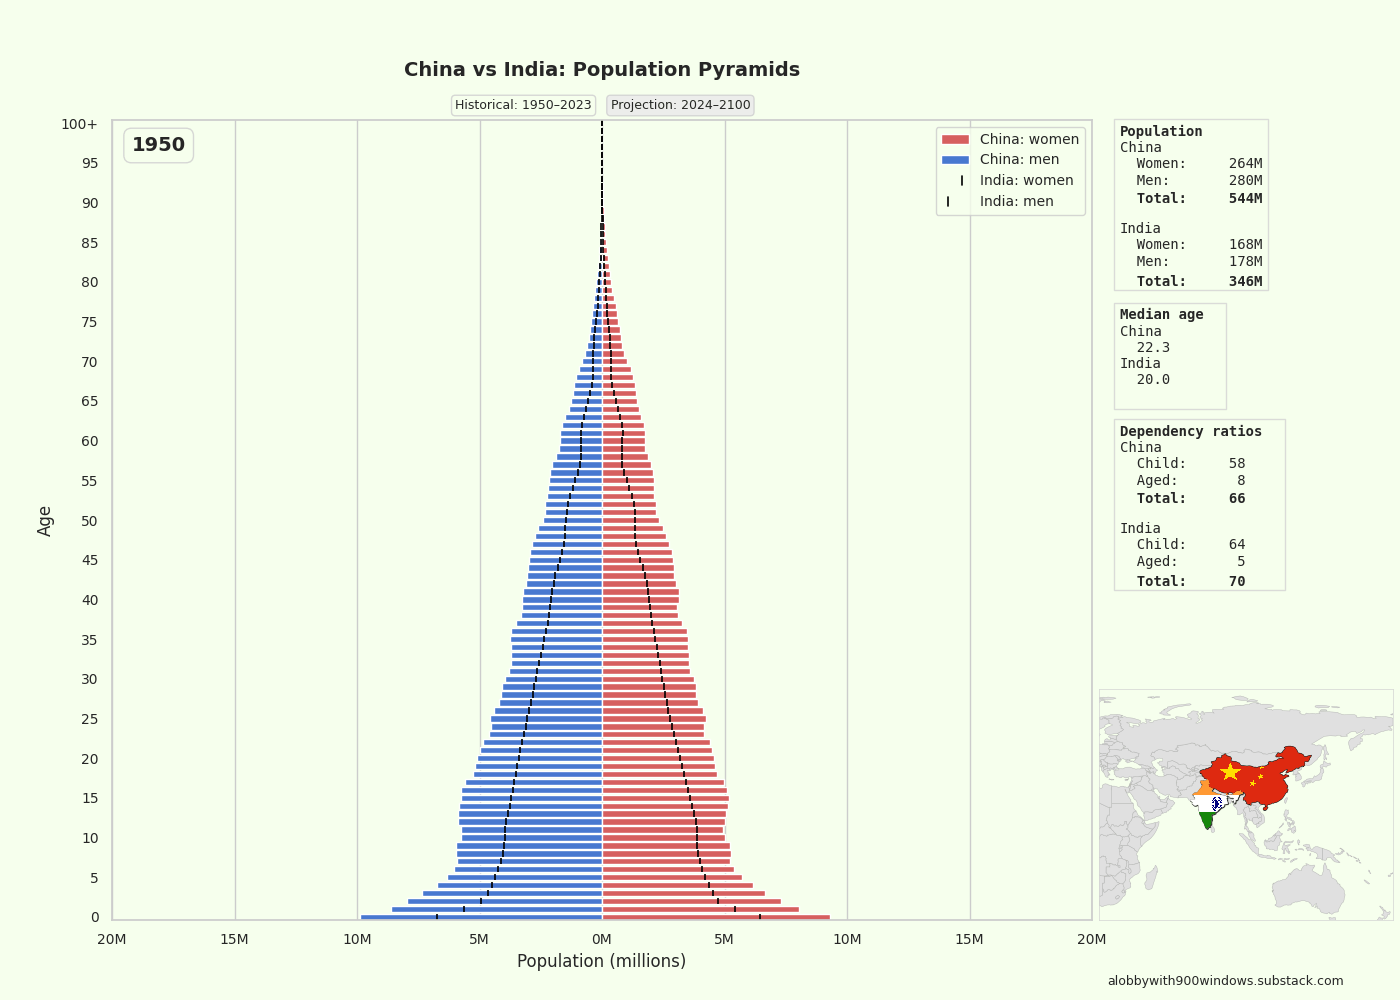
As part of a project I'm working on I've created this animation showing the different population pyramids of China and India. I've added some info on population sizes, median age and dependency ratios to the right. The data from 1950-2023 is historical, 2024-2100 is the UN's medium-variant projection.
Population and median age should be self-explanatory. Dependency ratios are a way to measure the share of children and retirees in a population. For international comparisons 0-14 years of age counts as children, 15-64 as working age and 65+ as aged. The child dependency is calculated as (the number of children) / (the number of working age adults) * 100. Aged dependency is calculated as (the number of aged) / (the number of working age adults) * 100. The total is just child + aged dependency ratios. So in a population of 2000, with 600 children, 1000 working age adults and 400 aged we get the child dependency of 60, aged dependency as 40 and total dependency as 100. Hope it makes sense.
A video of this animation can be found here. I've not written or uploaded it to the linked substack yet, so don't look for it there.
The data is from the UN's World Population Prospects 2024.
The animations are made with Python and primarily matplotlib.
I welcome suggestions and constructive criticism with the understanding I may choose to ignore it completely.
If it seems people find it interesting I'll upload a few other comparisons I find interesting here on r/dataisbeautiful in the future and I am open to suggestions of countries or regions to compare. Note that I can scale the population of one country/region to another if what is interesting is comparing the actual population pyramids to each other. So it is possible to compare Iceland to the world without Iceland's pyramid turning into a tiny sliver in the middle of the animation.
In any case some more will be uploaded to my YouTube channel.
by Alobbywith900windows
3 Comments
Yeah the visualization is cool and there is definitely difference between the 2 countries. I don’t know a lot about the population topic so would be nice that someone more knowledgeable about it can explain the past behaviors and somehow draw some insights from this.
Even if the fertility rate of India is far below 2, the population of India will still grow for a while, while the population is very young and not many people die each year. The population will only shrink if the total number of birth is lower than a lifetime ago.
add 2 horizontal lines for upper and lower productive age