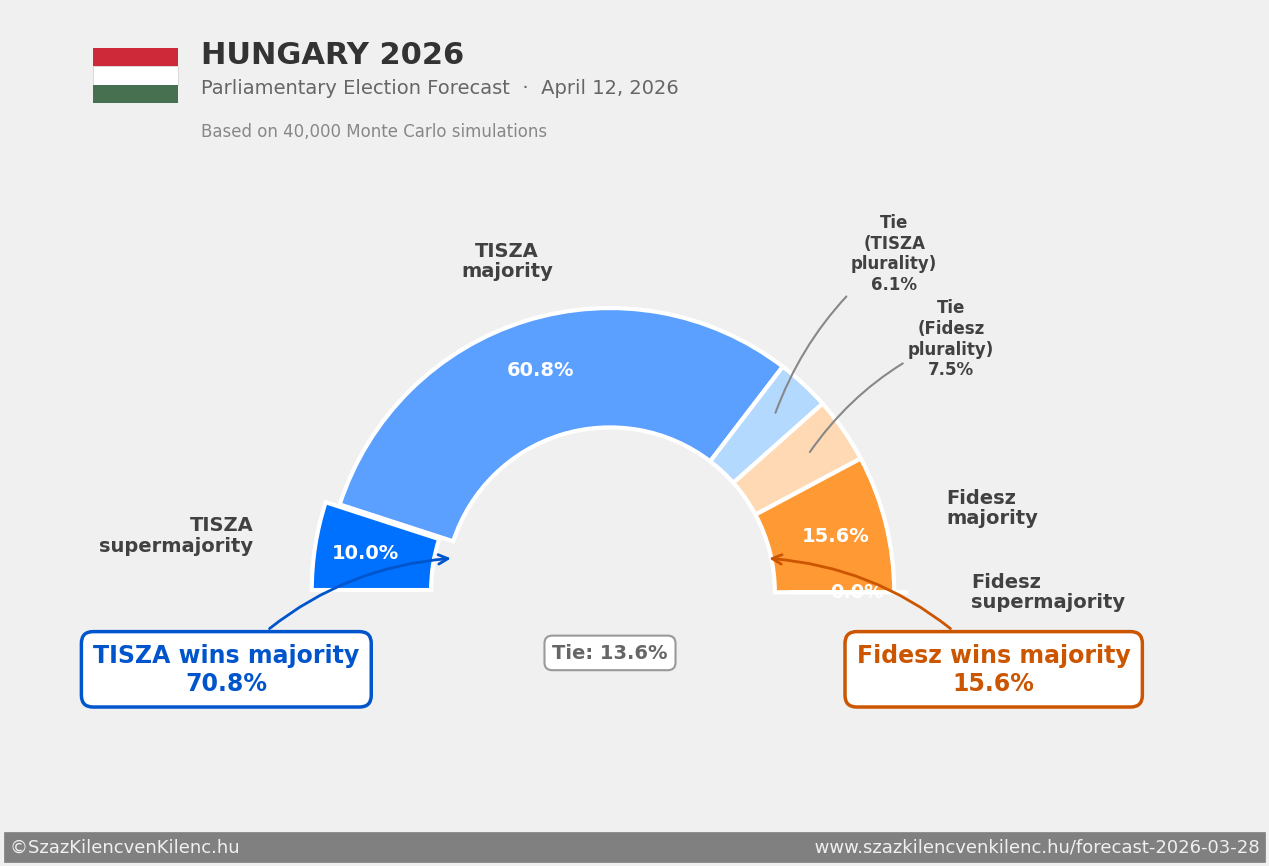
This is my third update here. The first time it was a coin flip. The second time TISZA (opposition) had pulled ahead. Now the picture has shifted again.
The shift since my last r/dataisbeautiful post (March 8):
– TISZA (opposition) majority: 71.7% → 79.7% (+8pp)
– Fidesz (Orbán) majority: 16.9% → 12.4% (-4.5pp)
– Deadlock: 11.4% → 7.9% (-3.5pp)
– Mi Hazánk enters parliament: 72.8% → 61.0% (-11.8pp)
Last time the story was Mi Hazánk (far-right) surging toward parliament and making everything more complex. That trend has now reversed: their entry probability dropped from a peak of 81.6% to 61.0%. Without a third party splitting seats, TISZA’s vote lead converts more directly into a seat majority.
Orbán’s own numbers haven’t moved. But the math around him has.
Happy to answer questions about the model, the methodology, or Hungarian politics.
Ghost__24 on
Where are the arrows pointing to and why did you not outline the numbers with black? Especially the 0,0% for the Fidez supermajority?
SirHawrk on
The Data is very interesing but the visualization isnt great.
Arrows pointing to nowhere, the 0.0% is barely readable
reviedox on
What are the chances of Fidesz stealing the elections? Is democracy in Hungary still healthy enough, or does Orbán have shady friends that could keep him in power, if Tisza was about to win?

5 Comments
This is my third update here. The first time it was a coin flip. The second time TISZA (opposition) had pulled ahead. Now the picture has shifted again.
The shift since my last r/dataisbeautiful post (March 8):
– TISZA (opposition) majority: 71.7% → 79.7% (+8pp)
– Fidesz (Orbán) majority: 16.9% → 12.4% (-4.5pp)
– Deadlock: 11.4% → 7.9% (-3.5pp)
– Mi Hazánk enters parliament: 72.8% → 61.0% (-11.8pp)
Last time the story was Mi Hazánk (far-right) surging toward parliament and making everything more complex. That trend has now reversed: their entry probability dropped from a peak of 81.6% to 61.0%. Without a third party splitting seats, TISZA’s vote lead converts more directly into a seat majority.
Orbán’s own numbers haven’t moved. But the math around him has.
Tools: Python, PyMC, matplotlib.
Data: from the Vox Populi polling database [www.kozvelemeny.org](http://www.kozvelemeny.org)
Full analysis: [https://www.szazkilencvenkilenc.hu/forecast-2026-03-28/](https://www.szazkilencvenkilenc.hu/forecast-2026-03-28/)
Methodology: [https://www.szazkilencvenkilenc.hu/methodology-v2/](https://www.szazkilencvenkilenc.hu/methodology-v2/)
The model (Krónikás/Chronicler) is just open-sourced: [https://github.com/vtisza/kronikas/](https://github.com/vtisza/kronikas/)
Happy to answer questions about the model, the methodology, or Hungarian politics.
Where are the arrows pointing to and why did you not outline the numbers with black? Especially the 0,0% for the Fidez supermajority?
The Data is very interesing but the visualization isnt great.
Arrows pointing to nowhere, the 0.0% is barely readable
What are the chances of Fidesz stealing the elections? Is democracy in Hungary still healthy enough, or does Orbán have shady friends that could keep him in power, if Tisza was about to win?
Not Relevant even for popular vote.