
Context: 2026 nation-wide polls for each city's council.
Nearly every party claimed victory, cities were traded like Pokemon cards and contradictory analyses abound.
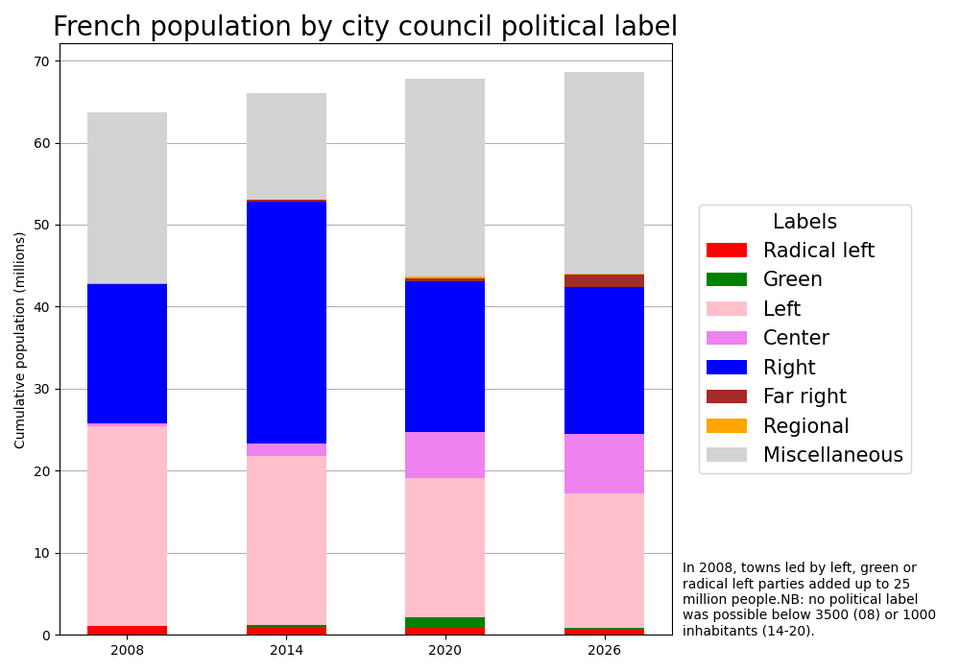
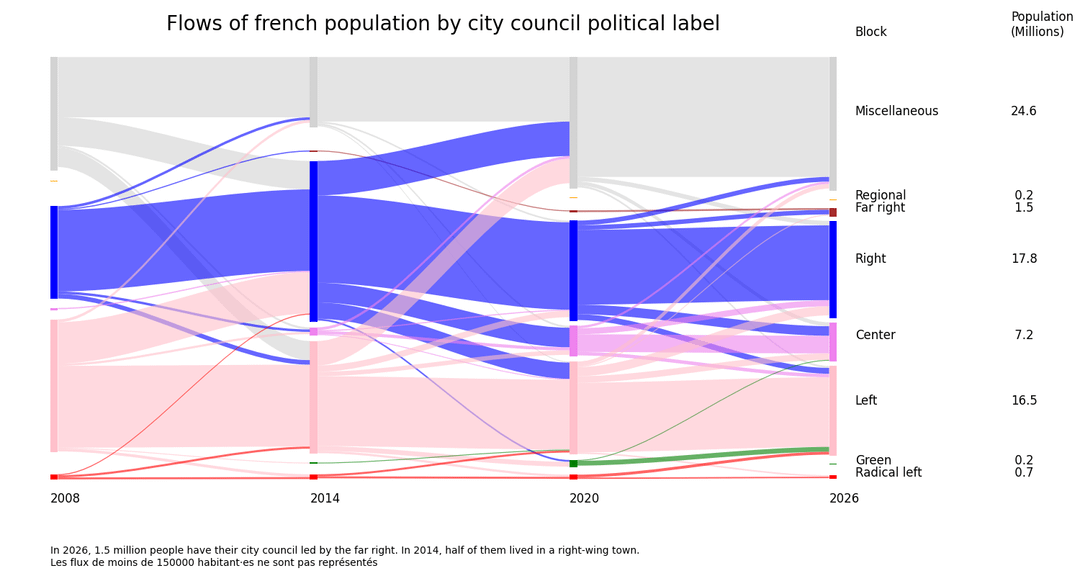
These charts represent the population living under every political block, from 2008, with flows between blocks being shown on the second one.
Main findings:
– Radical left is stagnating, despite LFI's real breakthrough performance
– Green town merge back into the left
– The left exhibits a structural decline after its 2008 peak
– The center leaps by 29%, following a movement away from the right started in 14, picking cities from the left and the right while both play a zero-sum game
– The right holds on
– Despite some disappointing results in big cities, far-right parties takes 340% gains, reaching 1.5 million inhabitants, mostly torn from right-wing towns.
– Unsorted or label-less towns account for 36% of the total, mostly stable except for the 2014 blue wave.
Far right and radical left mayors rule 3% of the population, which should lead to their parties being under-represented in a mayor-elected Senate, in comparison with the House (Assemblée Nationale).
by Felix_qui_potuit
1 Comment
Sources: [data.gouv.fr](http://data.gouv.fr), [interieur.gouv.fr](http://interieur.gouv.fr), [wikipedia.org](http://wikipedia.org)
Made with Python matplotlib, pandas and sankeyflow
Thanks to PyCharm developers