It appears that in the US this is mostly about old people who are in cognitive decline, particularly those in hospitals or assisted living, and often with other chronic diseases that disrupt food intake.
So the spike here seems to be more a case of assigning cause of death to this rather than to one of the other chronic diseases of old age. All cause mortality for people in those age brackets has not skyrocketd. This is not typically lack of food starvation in the US.
Whereas Brazil and North Korea have falling numbers because everyone is getting more food. And other countries are flat because they don’t categorize the deaths of older persons this way I assume? But this chart doesn’t show any of that.
angelbabyxoxox on
What is going on with the Norway stats? Something isn’t adding up
Jarkside on
I feel like this is a reporting problem. As in we report out stats one way and other countries us a different method.
Kinyrenk on
Eh, would want to look at the methodology of this data- the increase in Norway seems very weird, typically when overall mortality isn’t peaking, this is more often because medicine made some changes in attribution causes for deaths.
eldiablonoche on
US worse than N.Korea where detectors have admitted people literally eat grass like cattle to avoid starving to death?
Methinks there’s some context(s) being intentionally avoided to make this point.
Lupicia on
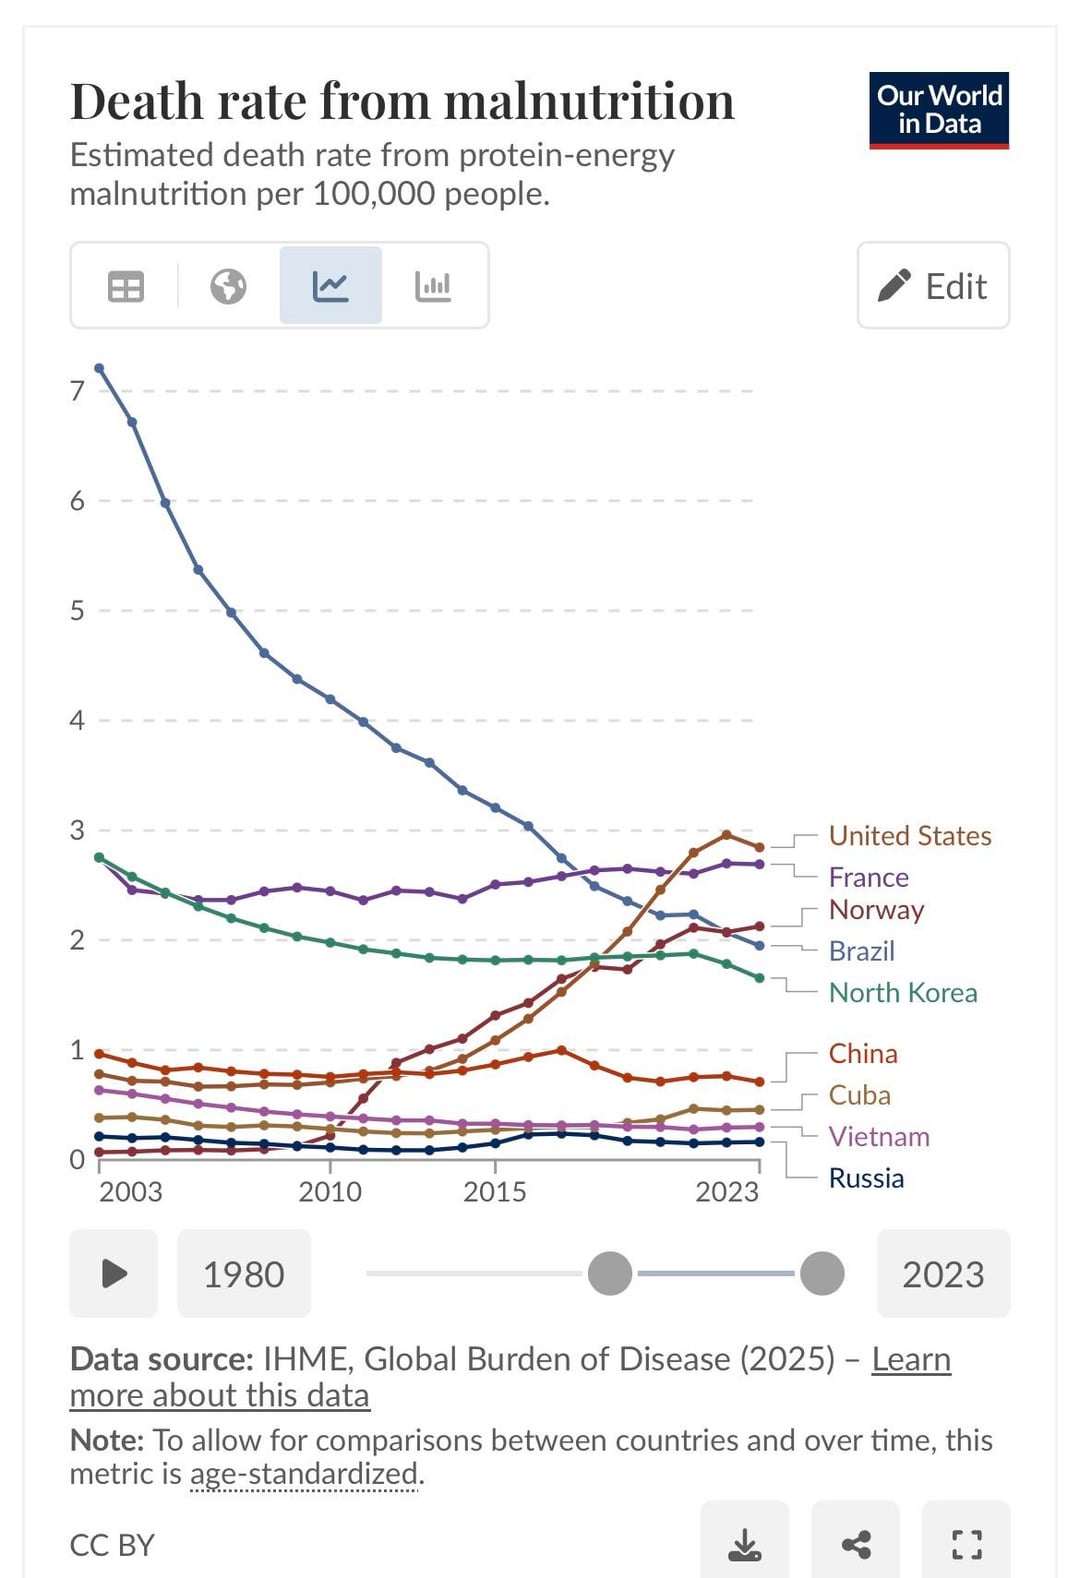
I mean, sure if you want to tell a story without context. Here’s a few more countries added in and a longer timescale.
We can see specific famine events (North Korea), and there is chronic malnutrition (sub-Saharan Africa), and then there’s developed countries who monitor, and countries that don’t monitor.
Here’s the original:
“Global Burden of Disease Collaborative Network. Global Burden of Disease Study 2023 (GBD 2023). Seattle, United States: Institute for Health Metrics and Evaluation (IHME), 2025. Available from https://vizhub.healthdata.org/gbd-results/.”
Here’s a paper on the rising disease of malnutrition in the US:
>These shifts may represent larger systemic and policy‐level changes over time. The increase in mortality after 2013 could be related to socioeconomic stressors, healthcare access, or possible weakening of safety net policies. For example, cuts to funding for SNAP (Supplemental Nutrition Assistance Program) and senior nutrition services after austerity measures may have increased nutritional vulnerabilities for older adults (Nestle 2019). Moreover, the COVID‐19 pandemic starting in 2020 likely exacerbated food insecurity and interrupted healthcare access, leading to under‐diagnosis or inadequate management of malnutrition, particularly in long‐term care facilities and home‐bound populations.
Cuts to social safety net and policy priorities to punish the poor since about 2013. This is what happens when GOP throttles revenue, funds armed conflicts, and also throws a fit about the debt.

11 Comments
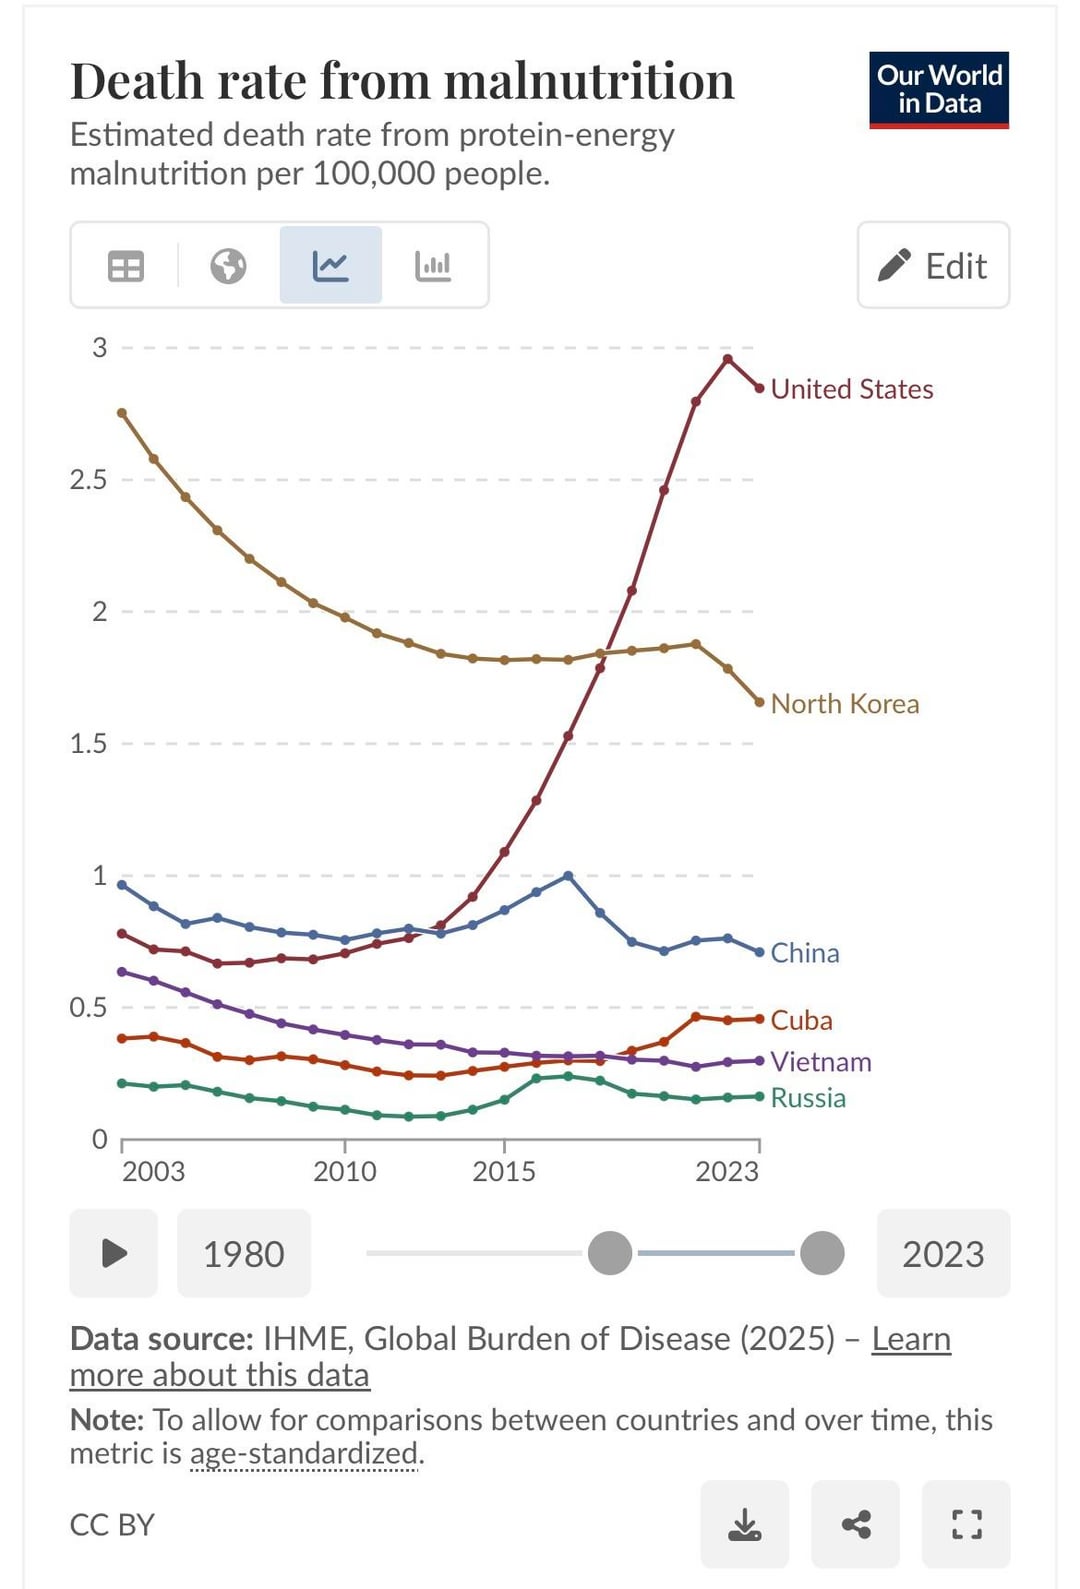
[Data](https://ourworldindata.org/grapher/malnutrition-death-rates?tab=line&time=2003..latest&country=CHN~VNM~CUB~PRK~USA~RUS)
2 per 100,000 people zoomed in to make it look more
Any explanation why the US spiked that hard in the last decade?
This data is neither beautiful or compelling
Could it be misattributed covid deaths?
This data seems not particularly informative. This data means different things in different countries, and isn’t directly comparable at all.
[https://agsjournals.onlinelibrary.wiley.com/doi/10.1111/jgs.70042](https://agsjournals.onlinelibrary.wiley.com/doi/10.1111/jgs.70042)
It appears that in the US this is mostly about old people who are in cognitive decline, particularly those in hospitals or assisted living, and often with other chronic diseases that disrupt food intake.
So the spike here seems to be more a case of assigning cause of death to this rather than to one of the other chronic diseases of old age. All cause mortality for people in those age brackets has not skyrocketd. This is not typically lack of food starvation in the US.
Whereas Brazil and North Korea have falling numbers because everyone is getting more food. And other countries are flat because they don’t categorize the deaths of older persons this way I assume? But this chart doesn’t show any of that.
What is going on with the Norway stats? Something isn’t adding up
I feel like this is a reporting problem. As in we report out stats one way and other countries us a different method.
Eh, would want to look at the methodology of this data- the increase in Norway seems very weird, typically when overall mortality isn’t peaking, this is more often because medicine made some changes in attribution causes for deaths.
US worse than N.Korea where detectors have admitted people literally eat grass like cattle to avoid starving to death?
Methinks there’s some context(s) being intentionally avoided to make this point.
I mean, sure if you want to tell a story without context. Here’s a few more countries added in and a longer timescale.
We can see specific famine events (North Korea), and there is chronic malnutrition (sub-Saharan Africa), and then there’s developed countries who monitor, and countries that don’t monitor.
https://ourworldindata.org/grapher/malnutrition-death-rates?tab=line&time=2000..2023&country=CHN~VNM~CUB~PRK~RUS~USA~NER~DEU~ITA~KOR~ZWE~PNG~SSD
Here’s the original:
“Global Burden of Disease Collaborative Network. Global Burden of Disease Study 2023 (GBD 2023). Seattle, United States: Institute for Health Metrics and Evaluation (IHME), 2025. Available from https://vizhub.healthdata.org/gbd-results/.”
Here’s a paper on the rising disease of malnutrition in the US:
https://pmc.ncbi.nlm.nih.gov/articles/PMC12542810/
>These shifts may represent larger systemic and policy‐level changes over time. The increase in mortality after 2013 could be related to socioeconomic stressors, healthcare access, or possible weakening of safety net policies. For example, cuts to funding for SNAP (Supplemental Nutrition Assistance Program) and senior nutrition services after austerity measures may have increased nutritional vulnerabilities for older adults (Nestle 2019). Moreover, the COVID‐19 pandemic starting in 2020 likely exacerbated food insecurity and interrupted healthcare access, leading to under‐diagnosis or inadequate management of malnutrition, particularly in long‐term care facilities and home‐bound populations.
Cuts to social safety net and policy priorities to punish the poor since about 2013. This is what happens when GOP throttles revenue, funds armed conflicts, and also throws a fit about the debt.
https://en.wikipedia.org/wiki/2013_United_States_federal_government_shutdown