
There’s a popular misconception that the global population is growing exponentially. But it’s not.
While the global population is still increasing in absolute numbers, population growth peaked decades ago.
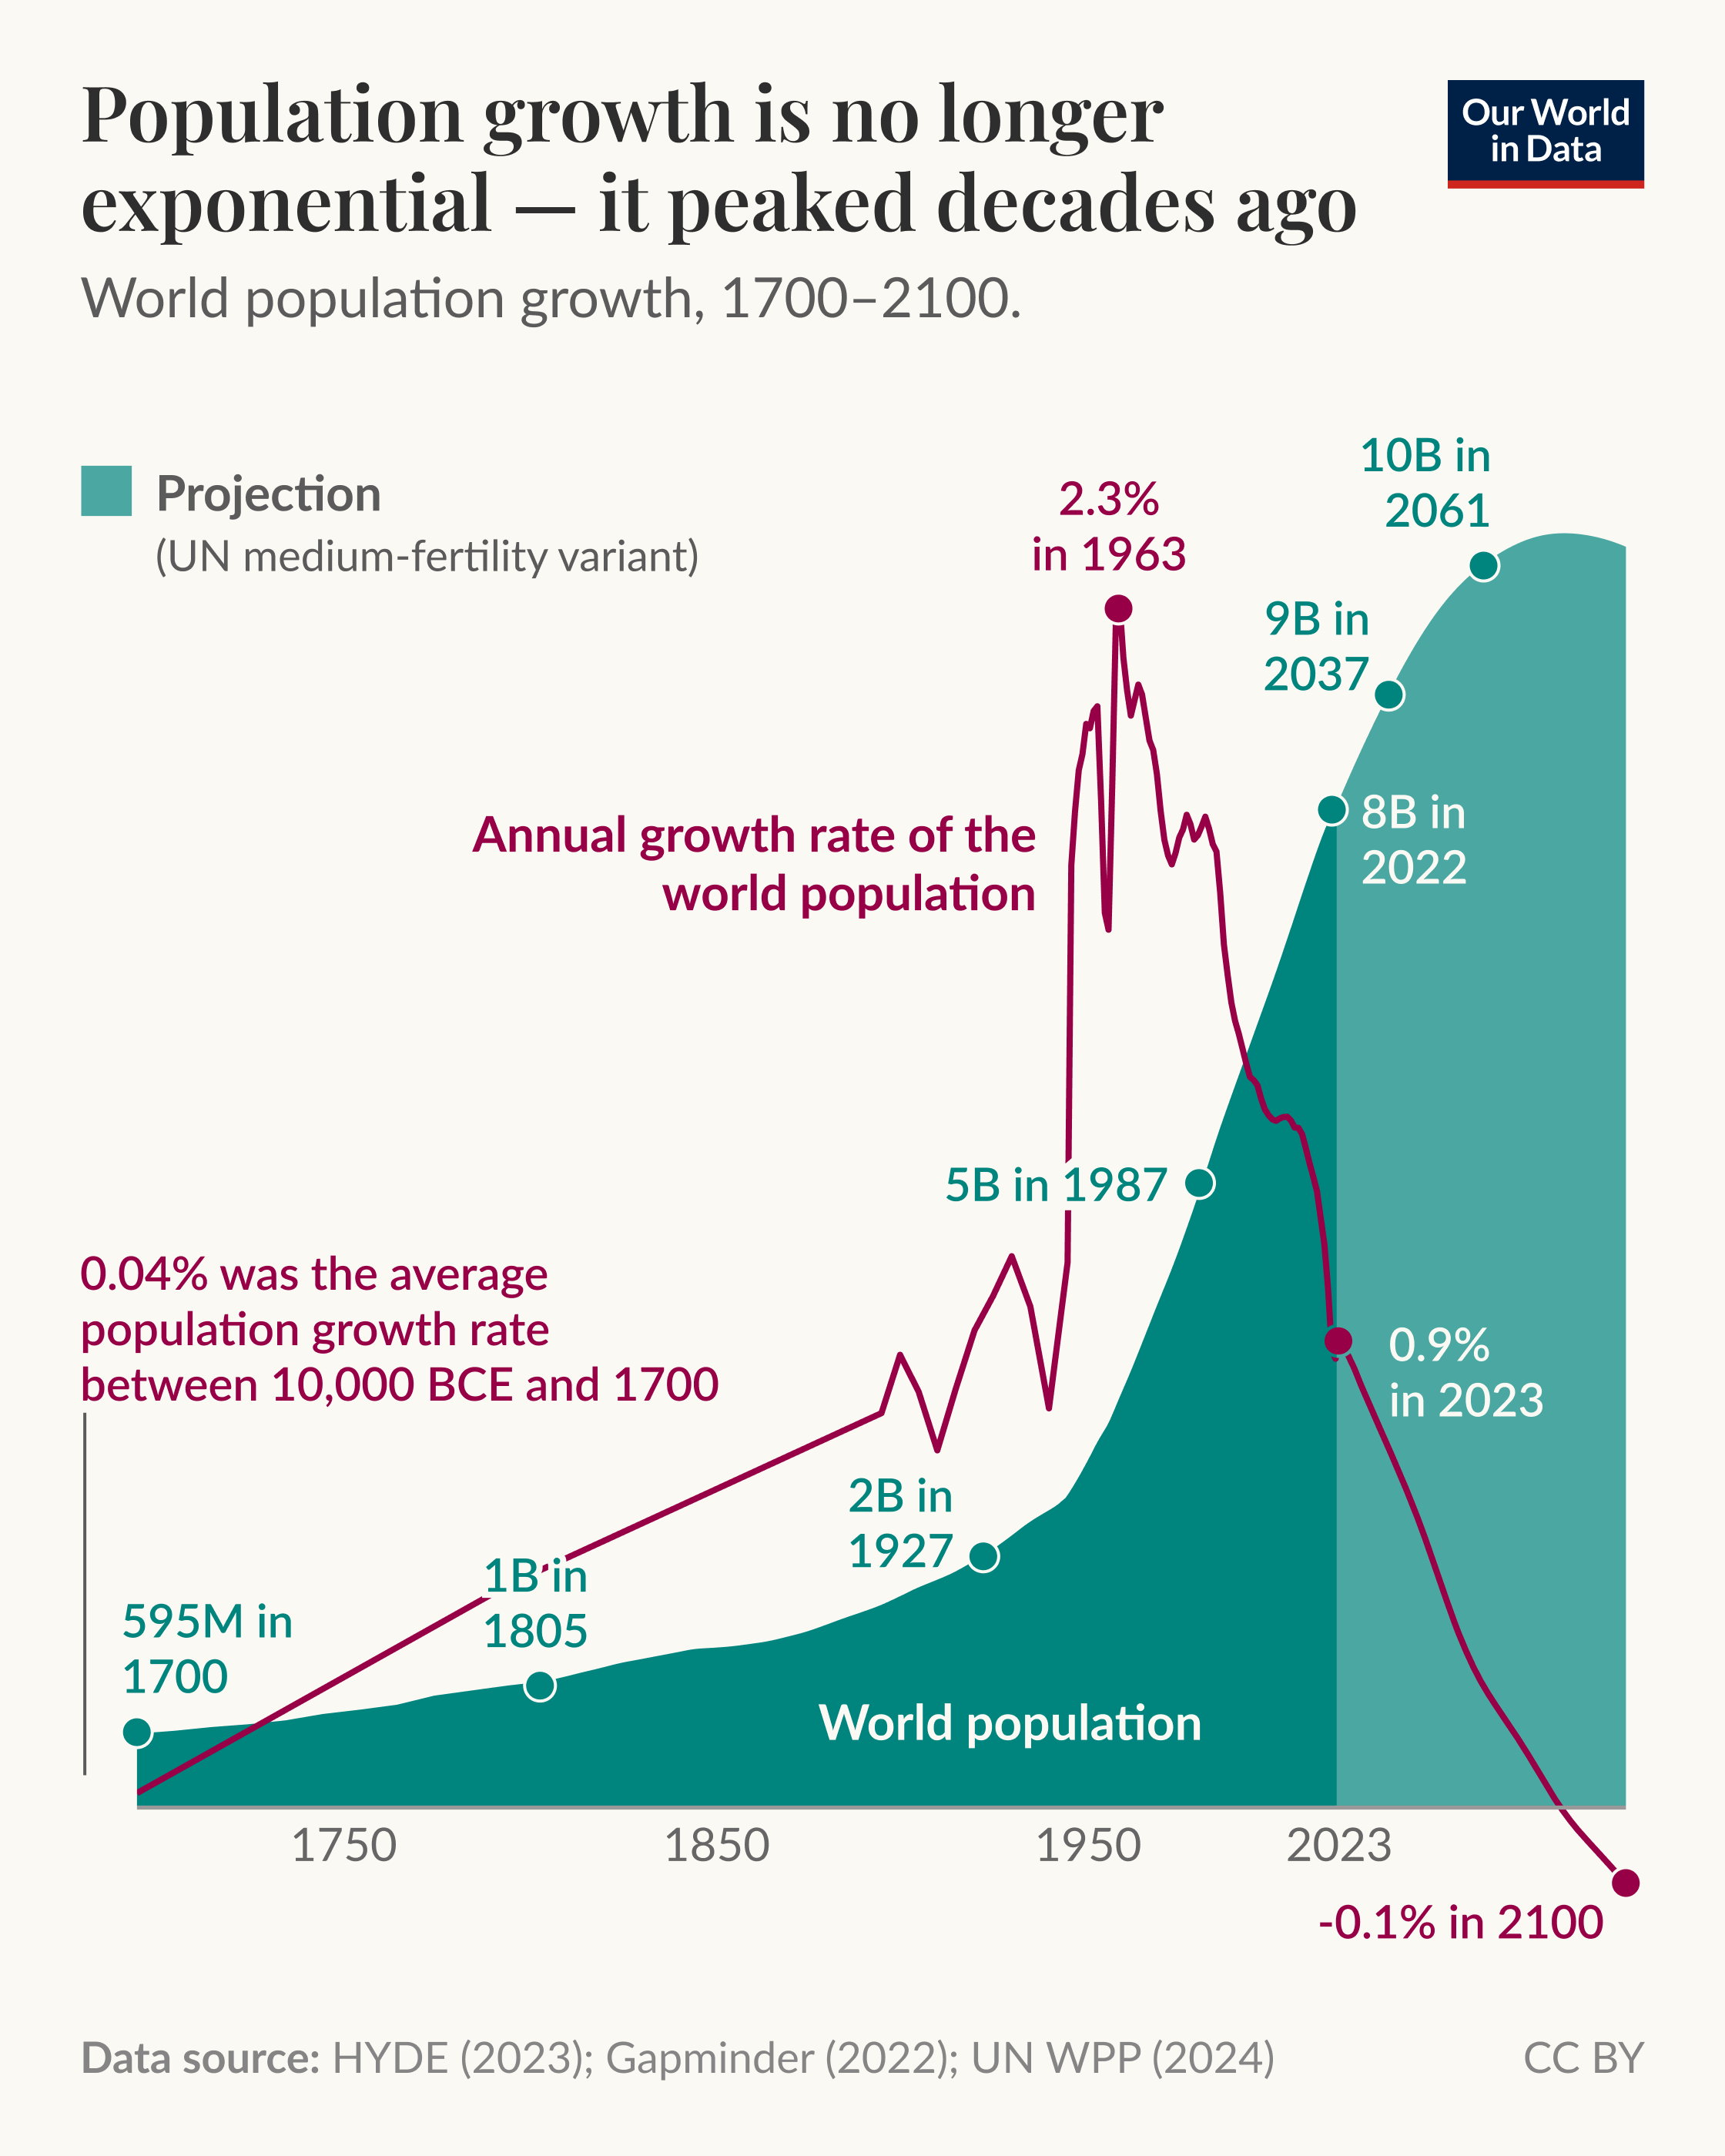
In the chart, we see the global population growth rate per year. This is based on historical UN estimates and its medium projection to 2100.
Global population growth peaked in the 1960s at over 2% per year. Since then, rates have more than halved, falling to less than 1%.
The UN expects rates to continue to fall until the end of the century. In fact, towards the end of the century, it projects negative growth, meaning the global population will shrink instead of grow.
Learn more in our article "How has world population growth changed over time?
by ourworldindata
6 Comments
**Data source:** HYDE (2023); Gapminder (2022); UN WPP (2024) (read [our detailed source methodology](https://ourworldindata.org/population-sources))
**Tools used:** the [OWID-Grapher](https://github.com/owid/owid-grapher) with finishing in Figma
Look at the trajectory 75 years ago, we have no idea what it will look like in 2100.
It would be beautiful if it had some kind of error bar on the estimates.
Now do the UN fertility projections over time compared to real growth. They’re consistently too high, we’ll never see a world with 10B humans.
Holy extrapolation batman.
Assuming current trends will continue for 75 years without any justification is ridiculous.
Gonna be interesting to see if we hit that 10 billion or not. Might just make it, might not. Then it goes back down for a while.