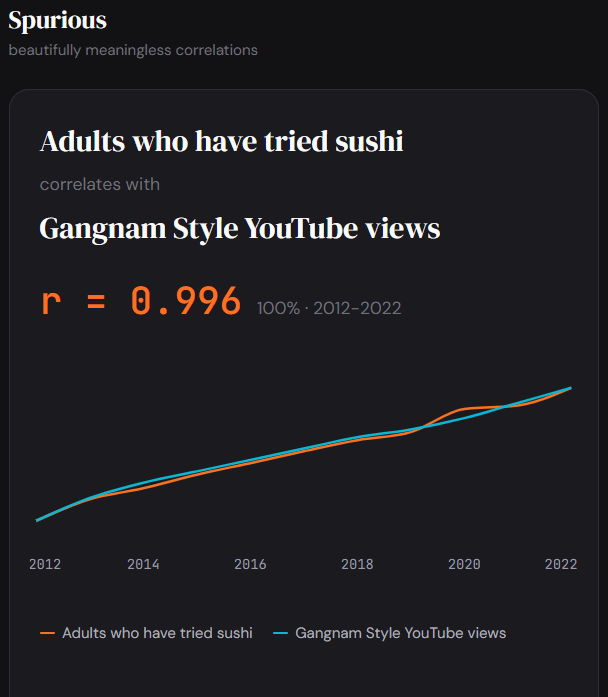
**Source data:** National Restaurant Association (sushi consumption surveys), YouTube public analytics (Gangnam Style cumulative views)
**Tool:** I built [getspurious.com]([https://getspurious.com](https://getspurious.com)) — it calculates Pearson correlation coefficients across 269 real public datasets from USDA, CDC, FBI, YouTube, and other sources. It finds
thousands of these beautifully meaningless correlations.
Some other gems it found:
– Daily newspaper circulation vs Baby Shark YouTube views: r = -0.996
– US kombucha market size vs average NFL player salary: r = 0.996
– Smoking rate among US adults vs Gangnam Style views: r = -0.993
– Per capita mozzarella consumption vs deaths from falling out of bed: r = 0.996
All real data. All completely spurious. Correlation ≠ causation, but it does waggle its eyebrows suggestively.
username_elephant on
Now try the correlation before 2012.
Invade_Deez_Nutz on
Wouldn’t both be a function of person-years?
Few-Interview-1996 on
Love it. It’s a very good joke, the pinnacle of such posts on this forum.
hausitron on
What’s the y axis here? If there are no absolute numbers for comparison, then it’s literally comparing a line to a line, in which case, R^2 will always be close to 1 if you just scale the slopes to look the same.
AWright5 on
What is the value of the Y axis? And how can these two figures be compared? Gangnam Style has more views than there are Americans in total
(not trying to slam-dunk you, I just don’t understand)
_BlueFire_ on
“should be on spurious- oh, wait, it’s from there” hilarious website

8 Comments
**Source data:** National Restaurant Association (sushi consumption surveys), YouTube public analytics (Gangnam Style cumulative views)
**Tool:** I built [getspurious.com]([https://getspurious.com](https://getspurious.com)) — it calculates Pearson correlation coefficients across 269 real public datasets from USDA, CDC, FBI, YouTube, and other sources. It finds
thousands of these beautifully meaningless correlations.
Some other gems it found:
– Daily newspaper circulation vs Baby Shark YouTube views: r = -0.996
– US kombucha market size vs average NFL player salary: r = 0.996
– Smoking rate among US adults vs Gangnam Style views: r = -0.993
– Per capita mozzarella consumption vs deaths from falling out of bed: r = 0.996
All real data. All completely spurious. Correlation ≠ causation, but it does waggle its eyebrows suggestively.
Now try the correlation before 2012.
Wouldn’t both be a function of person-years?
Love it. It’s a very good joke, the pinnacle of such posts on this forum.
What’s the y axis here? If there are no absolute numbers for comparison, then it’s literally comparing a line to a line, in which case, R^2 will always be close to 1 if you just scale the slopes to look the same.
What is the value of the Y axis? And how can these two figures be compared? Gangnam Style has more views than there are Americans in total
(not trying to slam-dunk you, I just don’t understand)
“should be on spurious- oh, wait, it’s from there” hilarious website
Gangnam Style is Korean BTW.