
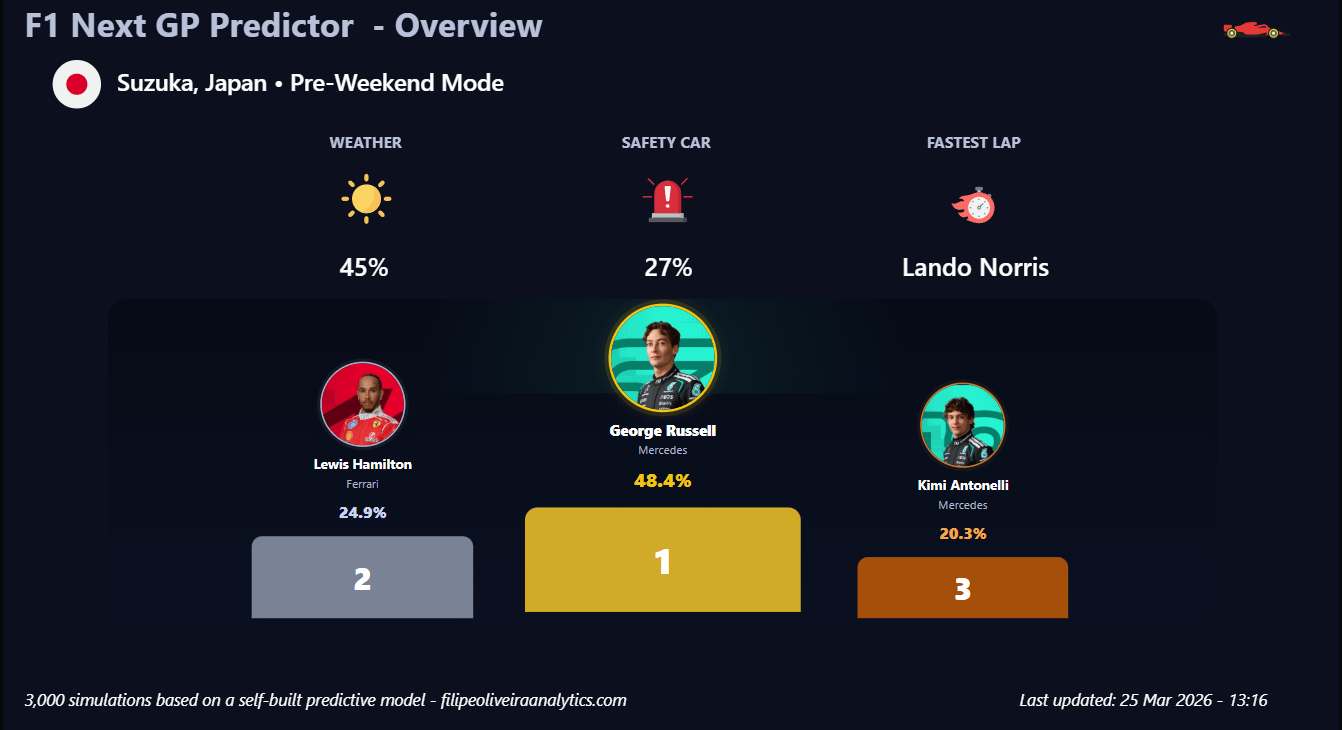
I built a simple simulation model to estimate race outcomes for the upcoming Suzuka GP.
The model runs 3,000 simulations and estimates win and podium probabilities based on:
– track characteristics (e.g. high-speed corners, traction)
– driver and team performance
– basic reliability assumptions (DNF probability)
Given the small sample size early in the season, this should be seen as an exploratory model rather than a precise prediction.
Happy to share more details if there's interest.
by filipeoliveira77
3 Comments
Source: Combination of publicly available F1 data (race results, lap times, and performance trends) using Python (including FastF1 where applicable).
Tool: Python for simulation (Monte Carlo ~3,000 runs) and Power BI for visualization. Some elements (like the podium) were built using HTML/CSS inside Power BI.
Method:
The model simulates race outcomes based on:
– track characteristics (e.g. high-speed layout, traction demands)
– recent driver and team performance
– simple reliability assumptions (DNF probability)
Given the early stage of the season, the dataset is still limited, so this should be seen as an exploratory model rather than a precise prediction.
I don’t know how impressive this is but it doesn’t fit this sub because that’s a 3 bar chart. Not beautiful. Just 3 bars.
I’m sorry but it’s going to look like this:
P1 Russell
P2 Antonelli
P3 Leclerc