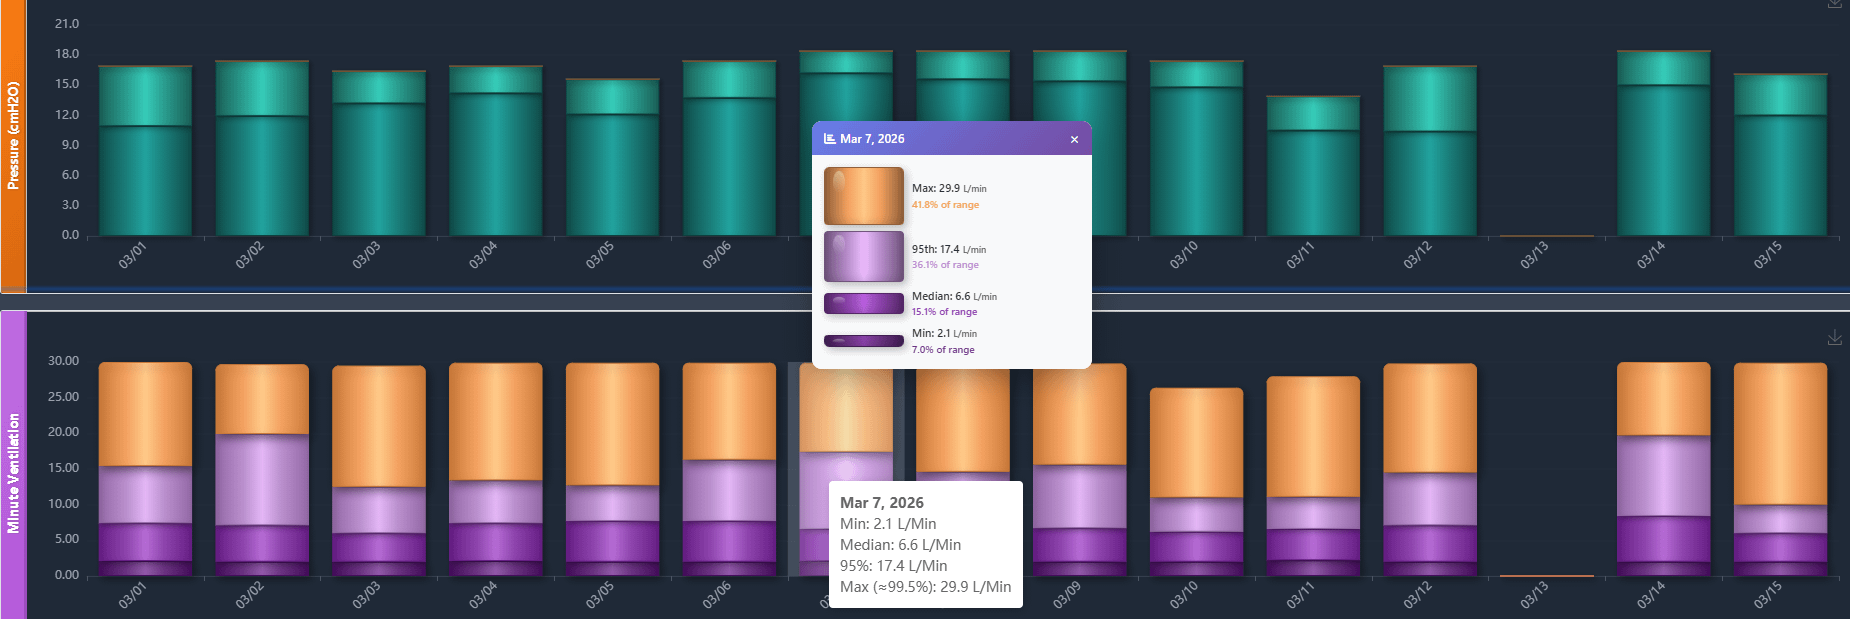
Data source: CPAP flow and pressure data
Method:
– Aggregate nightly breathing into distributions (min, median, 95th, ~max)
– Represent each night as stacked bars
– Compare pressure and volume behavior across time
Each bar encodes variability within a night, not just a single value.
by SomniCharts

1 Comment
Not a bad viz but if you want to look into alternative methods, check “box plots”.