
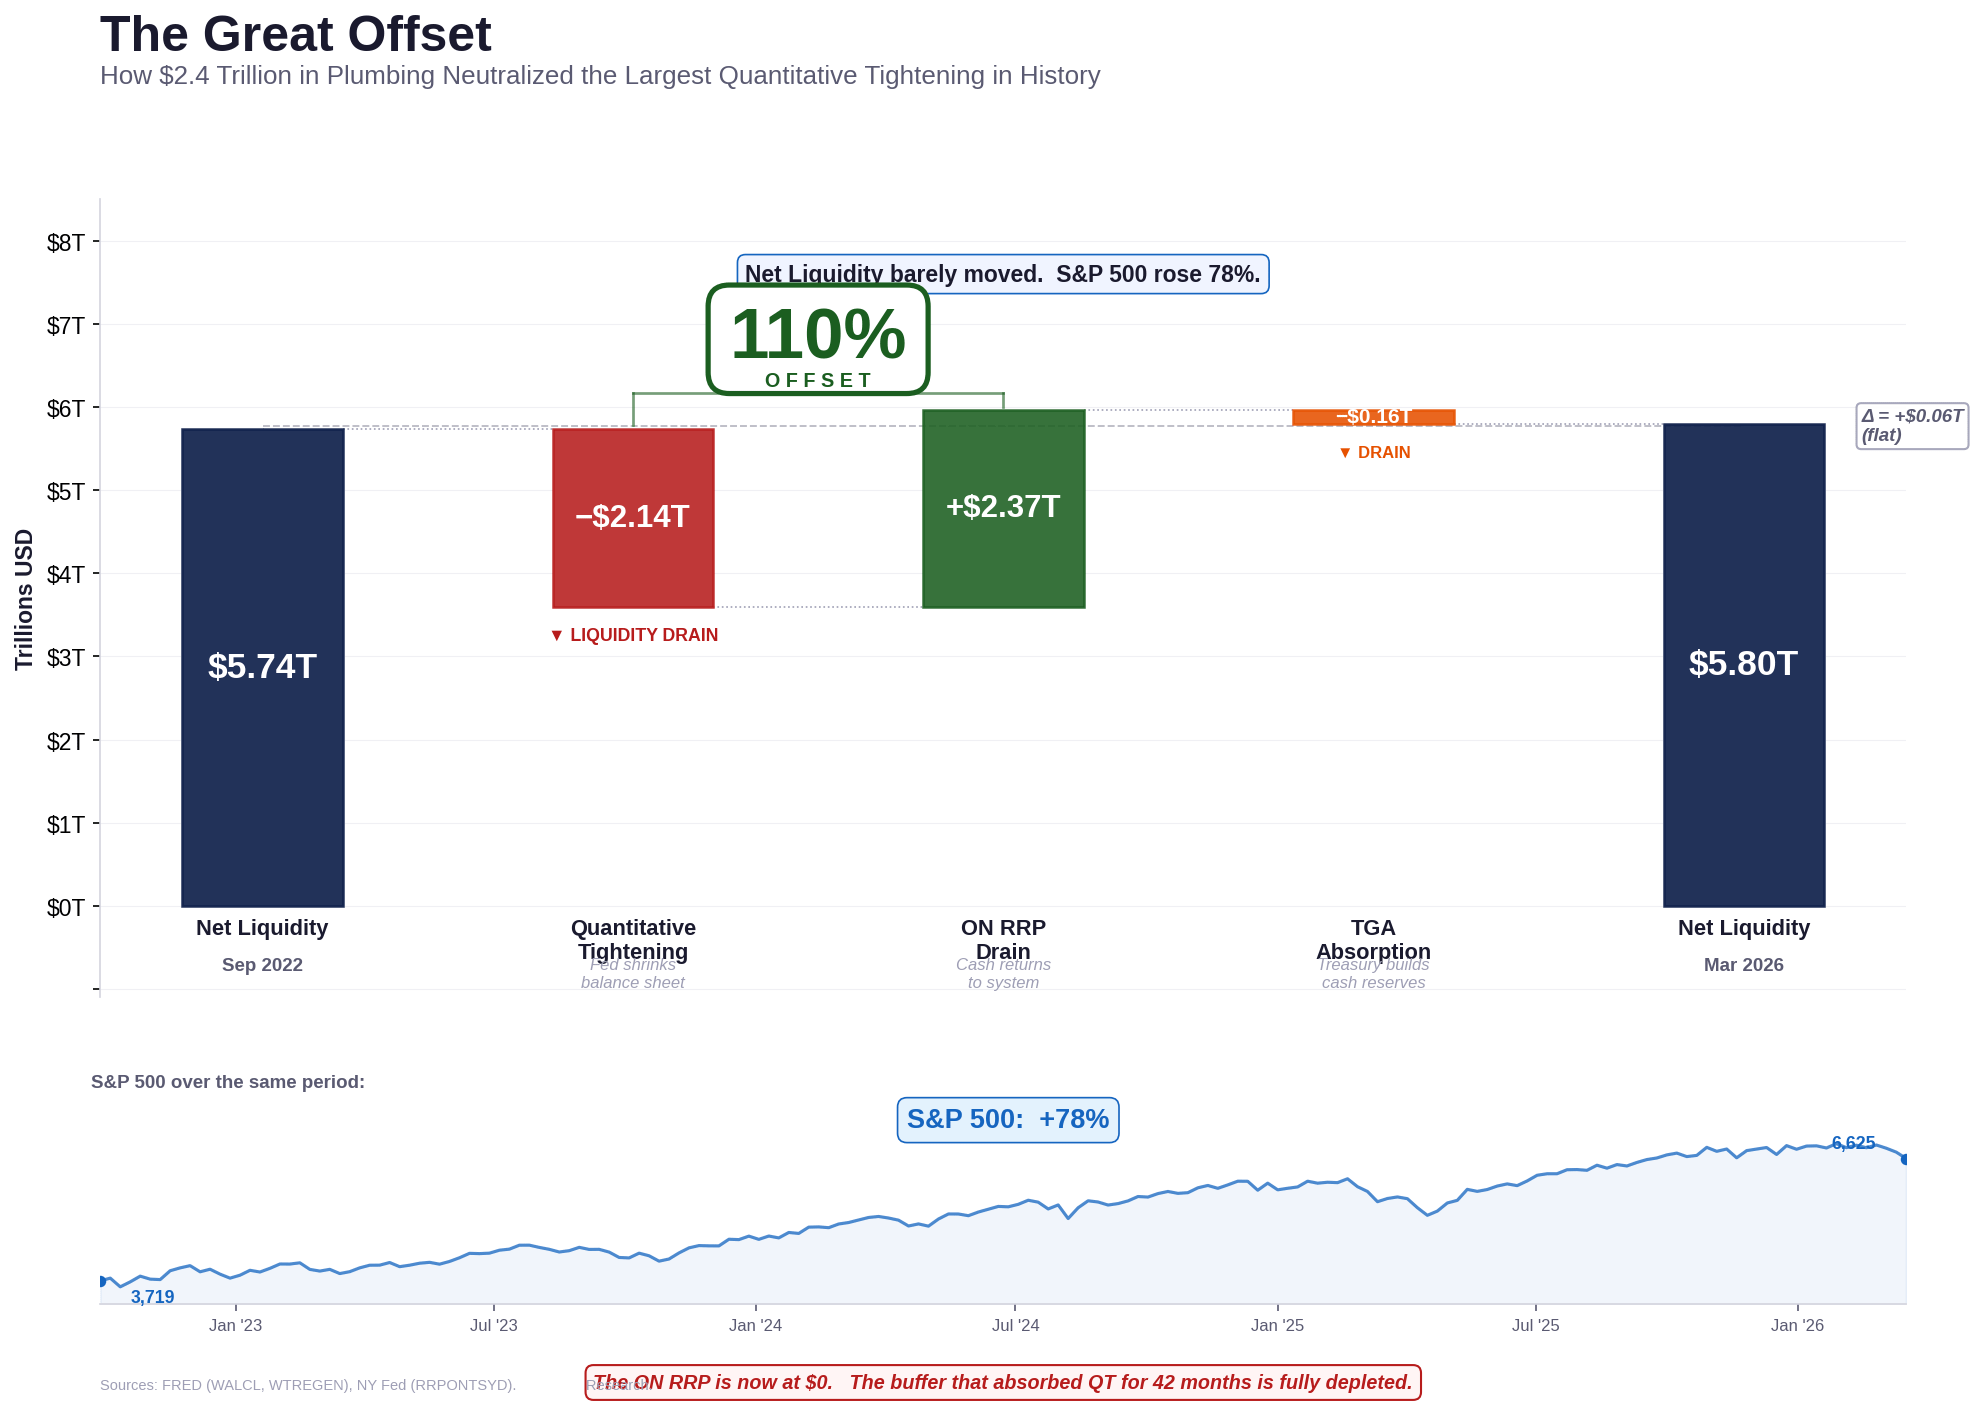
This waterfall chart decomposes the change in US financial system liquidity between September 2022 and March 2026.

Starting point: Net Liquidity of $5.74 trillion (Fed balance sheet minus Treasury General Account minus Overnight Reverse Repo).

Quantitative Tightening (−$2.14T): The Fed reduced its balance sheet from $8.80T to $6.66T — the largest QT in history.

ON RRP Drain (+$2.37T): Money market funds moved $2.37T out of the Fed’s reverse repo facility back into the market, more than offsetting QT.

TGA Absorption (−$0.16T): The Treasury’s cash balance rose modestly, draining a smaller amount.

Ending point: Net Liquidity of $5.80T — essentially flat despite $2.14T of balance sheet contraction. The S&P 500 rose 78% over the same period.

Sources: FRED (WALCL, WTREGEN), NY Fed (RRPONTSYD), S&P Dow Jones Indices (SP500).
Tool: Python (matplotlib).
Full dataset (1,212 weekly observations, CC BY 4.0): https://eco3min.fr/en/net-liquidity-index-dataset/
by Low_Ability4450
2 Comments
What does this mean? Stocks are overvalued and our economy is propped up on matchsticks?
ON RRP has been flat lined since Oct 2025. This liquidity wasn’t an injection but rather a temporary window to trade bonds for cash overnight (or vice versa) and then repurchase them later. Those funds didn’t remain. I think your conclusions are off.
If you look at just Repos (RPONTSYD), they spiked last year when money got tight for banks and the Fed slowed it’s balance sheet reduction.