
I created this graphic using Excel to compare the average annual sunlight hours of many US cities. Wikipedia uses NOAA data, but the year range varies between the cities (usually 1960-2020) and I had trouble finding the original source data. A handful of larger cities did not have data and weren't included like Orlando.
Sources: https://en.wikipedia.org/wiki/List\_of\_cities\_by\_sunshine\_duration and https://en.wikipedia.org/wiki/Category:United\_States\_weatherbox\_templates
by TA-MajestyPalm
12 Comments
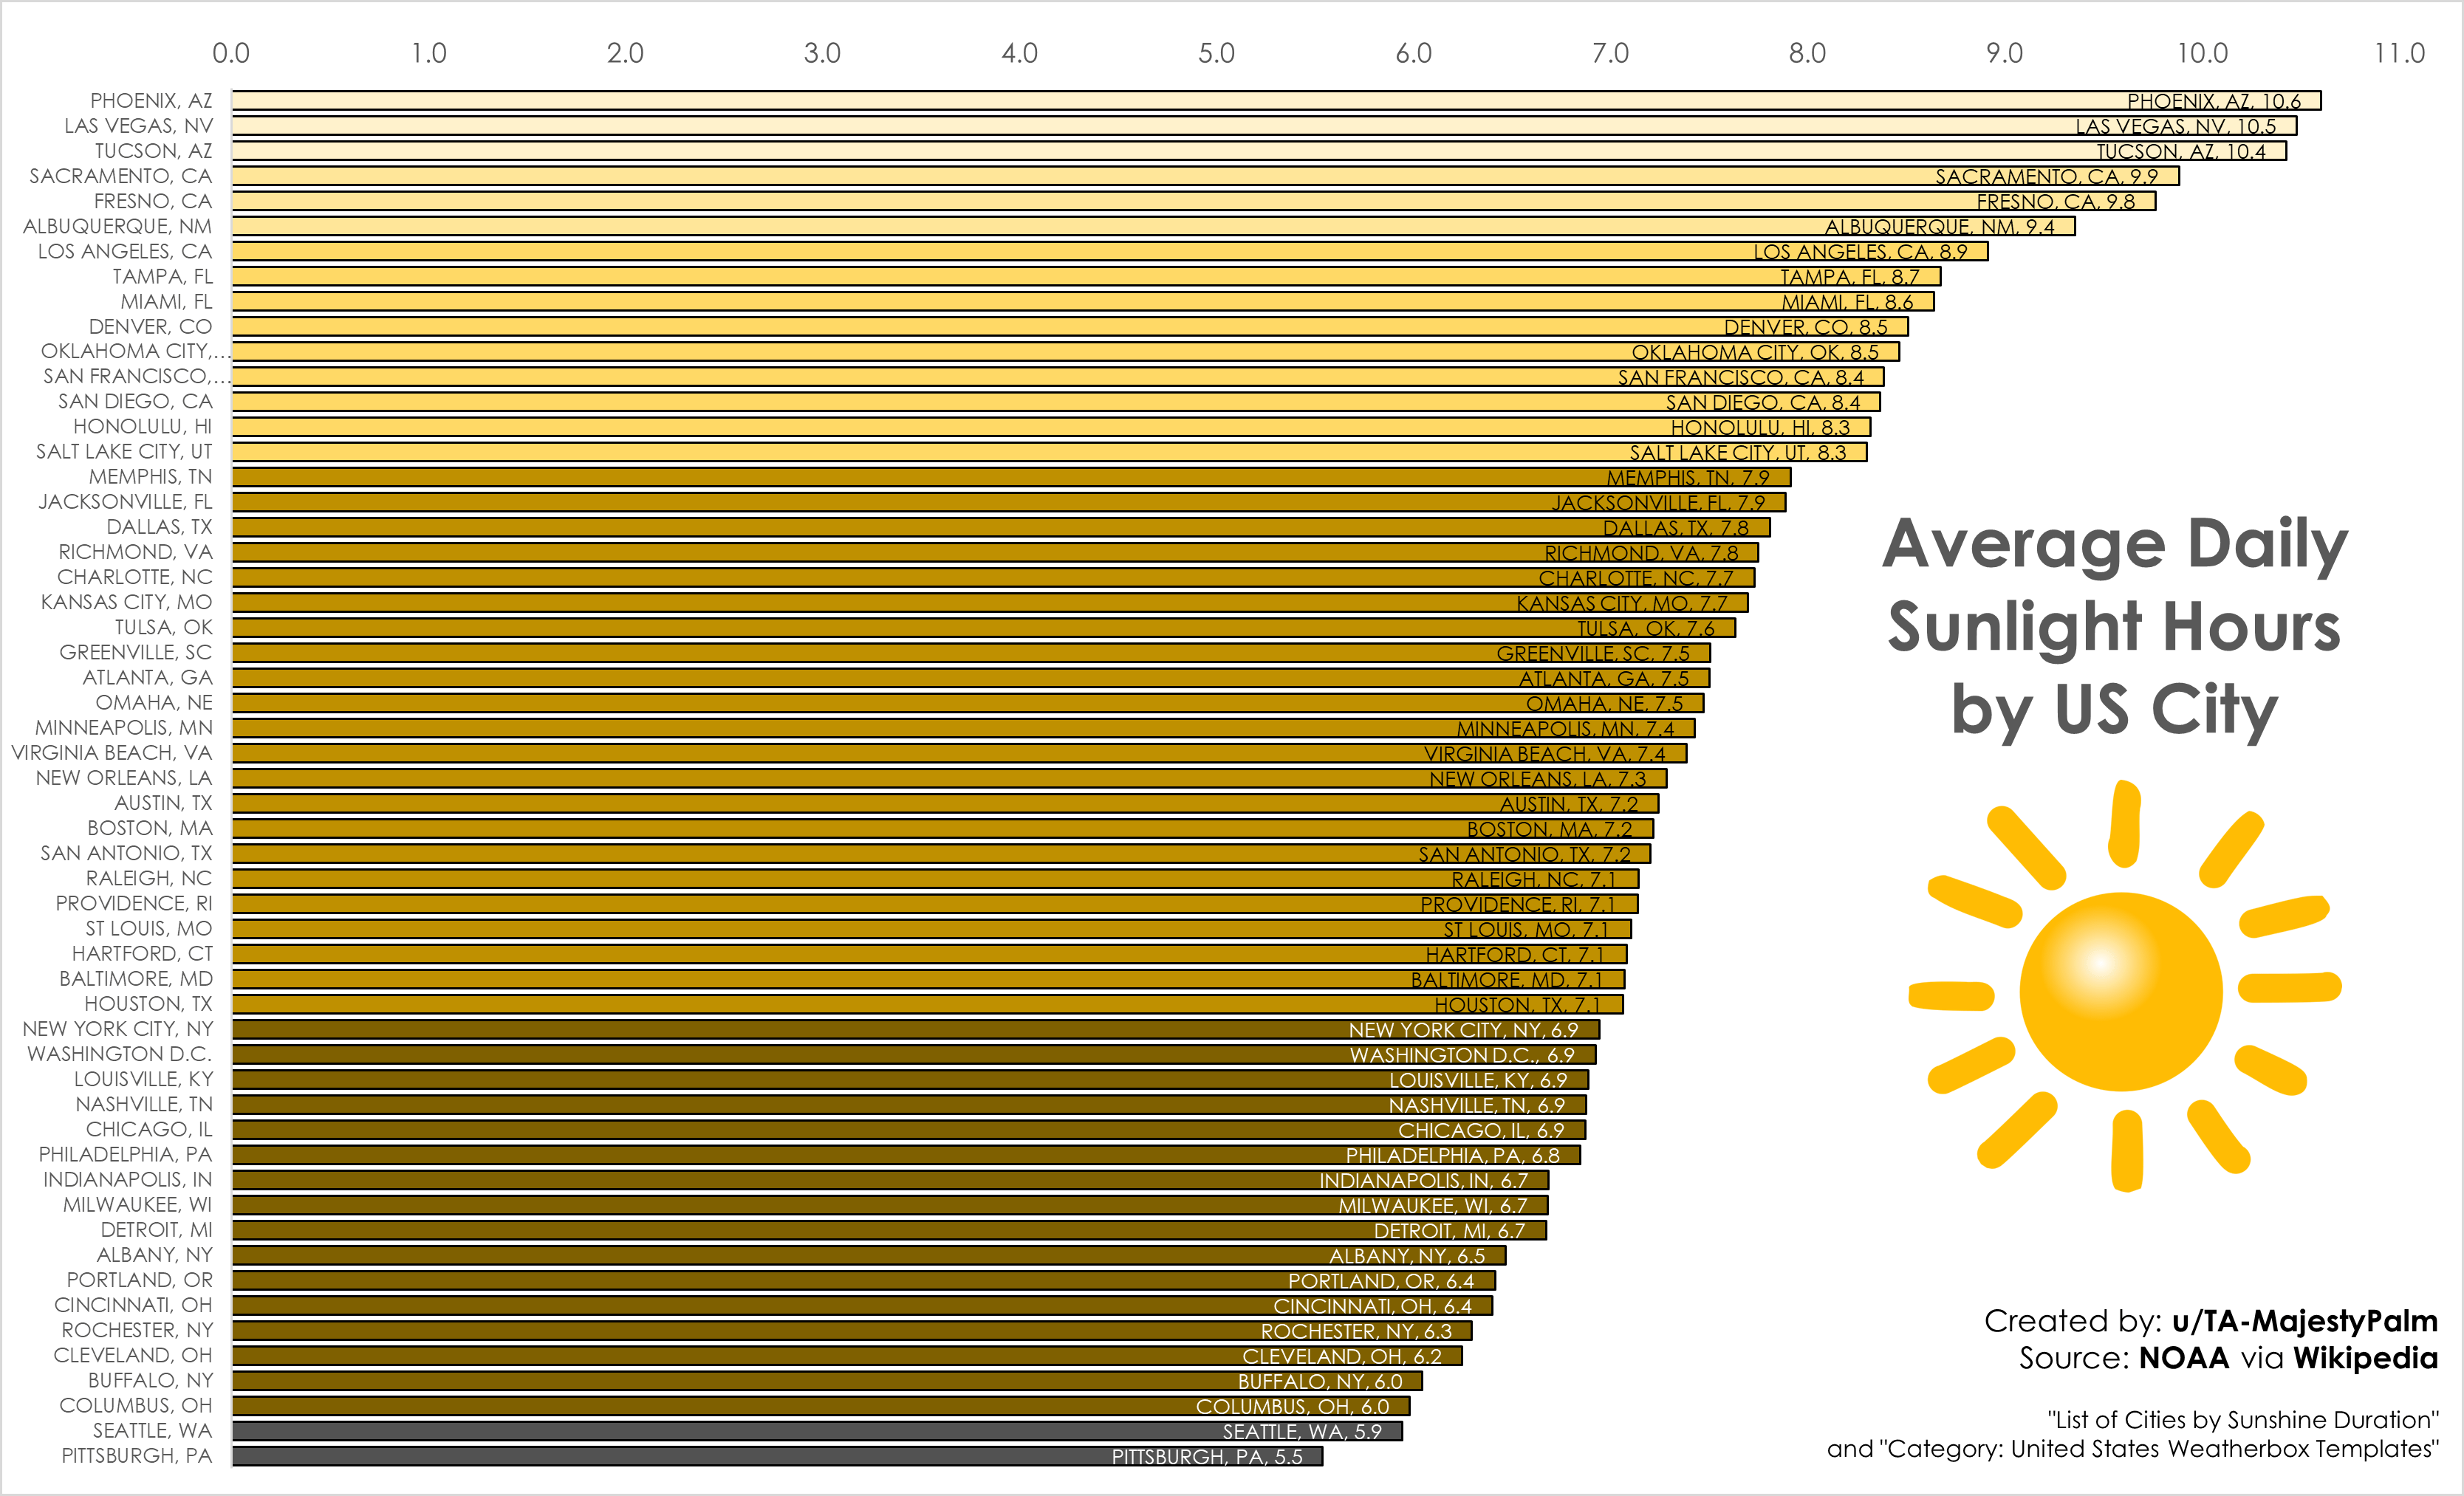
I created this graphic using Excel as I thought it would be interesting to see how sunny (or not sunny) different US cities are. Wikipedia uses NOAA data, but the year range varies between the cities (usually 1960-2020) and I had trouble finding the original source data. A handful of larger cities did not have data and weren’t included like Orlando.
Sources: https://en.wikipedia.org/wiki/List_of_cities_by_sunshine_duration and https://en.wikipedia.org/wiki/Category:United_States_weatherbox_templates
Woooow I love the way the data is calculated and displayed!! Average hours per day is a super intuitive metric. Well done.
I’m surprised San Francisco is up so high. Having lived in Denver for a long time, I know it’s a very sunny place with little cloud cover. I haven’t spent much time in San Francisco, but I always picture San Francisco being more cloudy and cool. When I went the first time, I thought, “Oooh, California, warm!” It was August but still cool, and my shorts and Ts wouldn’t cut it. I had to buy a souvenir hoodie.
Edit: Yes, everything I’m reading mentions that San Francisco is more known for foggy days, and cities like San Diego are much sunnier. I’m wondering if San Francisco’s location on the sunshine list is a mistake. I don’t think it has more sunshine than San Diego and SLC…
If installing solar panels on my home in Pittsburgh makes financial sense, what the heck is the rest of the country waiting for? Y’all have it made!
NYC is tricky because you can live in apartments that get 0 minutes of direct sunlight per day
This really explains my seasonal depression in Pittsburgh.
Odd that Philly and Pittsburgh have such a large difference. What gives?
Looks good. My 2 cents: the you don’t need the city, state label inside the chart. And I don’t think you need the axis, since the label has the number. I feel like it would clean up the view a little, and it’s a really clean view. Like that font a lot.
I’m confused by the chart, if you filter that chart by hours of sun per year and divide by days in a year* they are in a totally different order..
except that this graph doesn’t make sense with the wikipedia data…
For instance, according to the wikipedia data, total hours of sunshine for the year-
pittsburgh – 2632.0 = 7.2 on average (graph says 5.5)
philly – 2498.4
portland – 2340.9
nashville – 2510.1
the graph is completely wrong for the data…. I’m guessing that’s because wikipedia says the data is dynamic there. and this is a static graph without a date for the data used…
There’s actually no way Cleveland had more than Pittsburgh, as someone who’s lived in both places. Cleveland skies are always gray, Pittsburgh summers have bright blue skies
My local Scottish town… less than 4 hours per day 🙁
And I have solar panels hahaha