Data from `https://www.rcc-acis.org/docs_webservices.html`Station ID used: `PHXthr` (ThreadEx Phoenix Area.
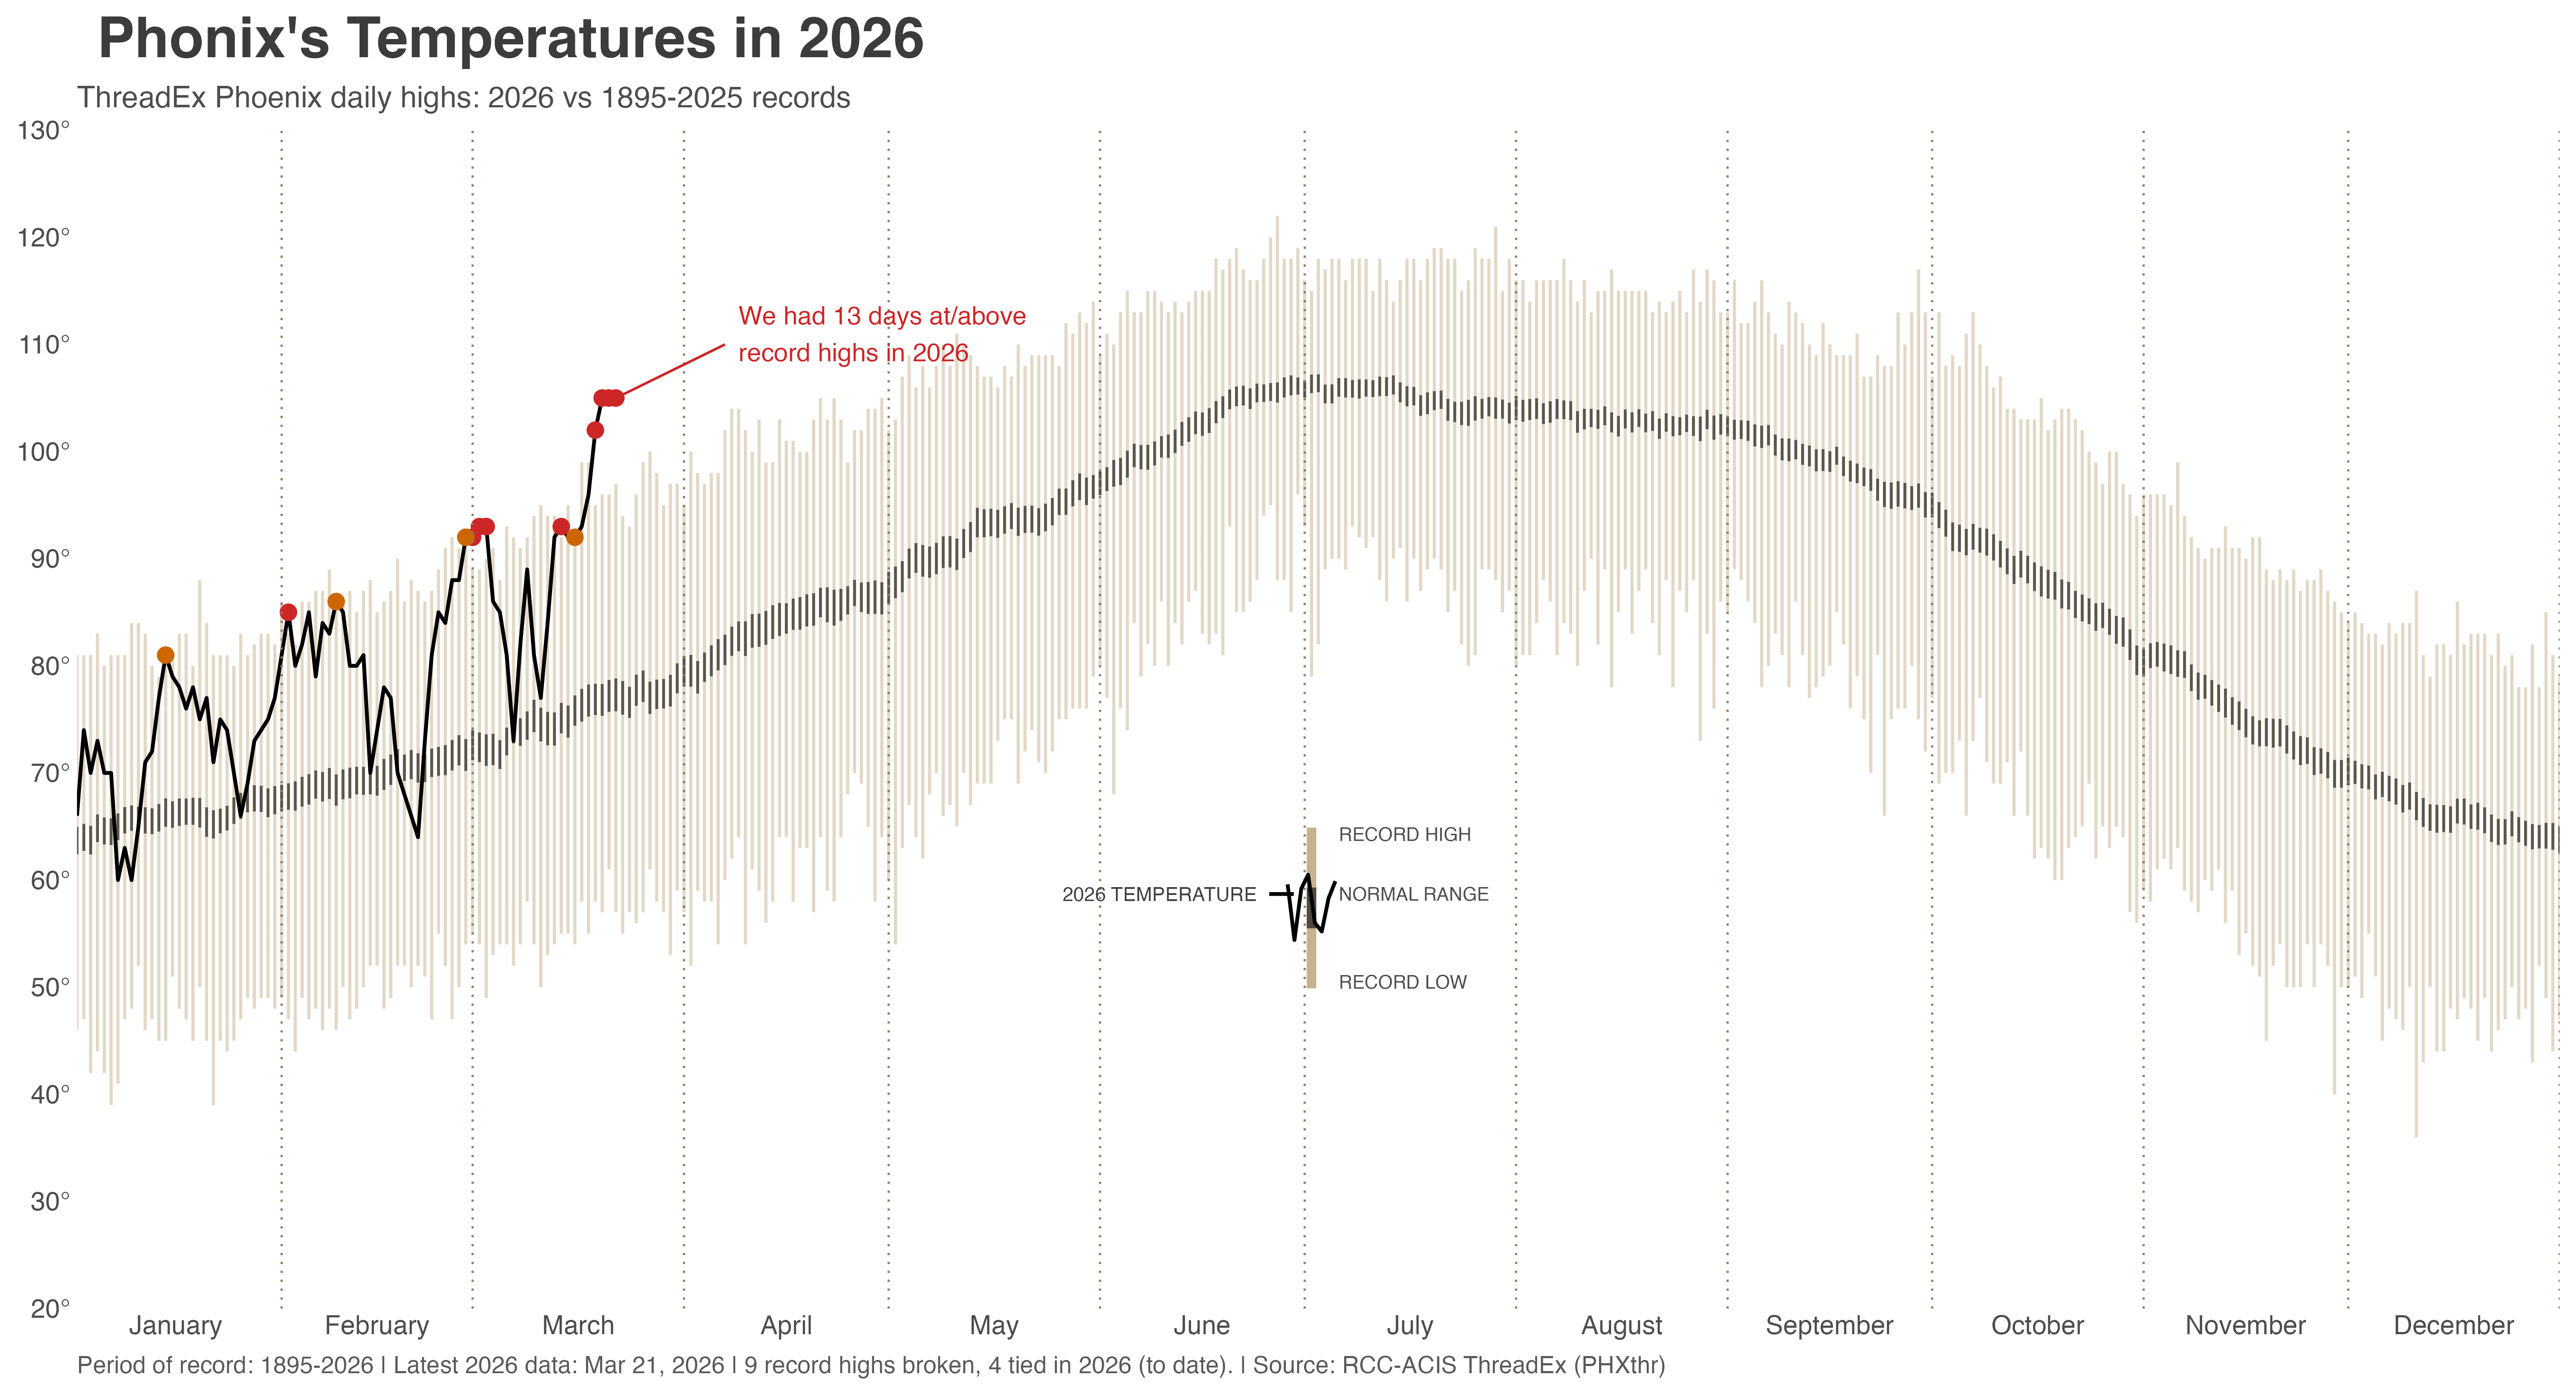
Normal range is built from historical Phoenix data (1895–2025) for each calendar day the historical mean daily high is calculated and then normal range plots a band of mean ± 2 × standard error. `Standard error is SD` = standard deviation of historical daily highs for that calendar day (across years before 2026) `divided by sqrt of n` = number of historical years available for that day.
LPNMP on
Climate change makes it hard to trust climate descriptions when looking for a place to move or visit.
SeveralBollocks_67 on
I’ve been to Phoenix a few times for work. I am pissed off at how huge that city is. Why the *fuck* anyone lives there?
maximumutility on
People who live in places that are miserably cold and wet for 75% of the year shit on places that are miserably hot for 25% of the year.
I recognize that the point of this post is that Phoenix is getting hotter earlier and the “nice” % of the year is decreasing. But more generally it catches more shit than it deserves from people who live in places with awful weather in the other direction for more days out of the year.
I think too-cold weather is “normal” for doughy white people and too-hot weather is comparatively unusual
xondk on
Isn’t it possible to slow cook from basically 50C/122F ? or close to it?
QuantumOverlord on
Its curious that the temperatures seem to peak at the end of June, that’s really early! Likewise the winter daytime highs are lowest in late December. There is almost no seasonal lag at all in Phoenix!
233C on
“You better start believing in climate change, you’re in one”

9 Comments
Global warming is just so hot right now.
To be fair, man was not meant to live in Phoenix in the first place.
Code rpackage ggplot2 using this tutorial on how to recreate Tufte’s graphic Code based on [https://rpubs.com/bradleyboehmke/weather_graphic](https://rpubs.com/bradleyboehmke/weather_graphic)
Data from `https://www.rcc-acis.org/docs_webservices.html`Station ID used: `PHXthr` (ThreadEx Phoenix Area.
Normal range is built from historical Phoenix data (1895–2025) for each calendar day the historical mean daily high is calculated and then normal range plots a band of mean ± 2 × standard error. `Standard error is SD` = standard deviation of historical daily highs for that calendar day (across years before 2026) `divided by sqrt of n` = number of historical years available for that day.
Climate change makes it hard to trust climate descriptions when looking for a place to move or visit.
I’ve been to Phoenix a few times for work. I am pissed off at how huge that city is. Why the *fuck* anyone lives there?
People who live in places that are miserably cold and wet for 75% of the year shit on places that are miserably hot for 25% of the year.
I recognize that the point of this post is that Phoenix is getting hotter earlier and the “nice” % of the year is decreasing. But more generally it catches more shit than it deserves from people who live in places with awful weather in the other direction for more days out of the year.
I think too-cold weather is “normal” for doughy white people and too-hot weather is comparatively unusual
Isn’t it possible to slow cook from basically 50C/122F ? or close to it?
Its curious that the temperatures seem to peak at the end of June, that’s really early! Likewise the winter daytime highs are lowest in late December. There is almost no seasonal lag at all in Phoenix!
“You better start believing in climate change, you’re in one”