
Been working on this for a while. The score works like this:
- Pulls official police incident data (SFPD, CPD, UK Police API)
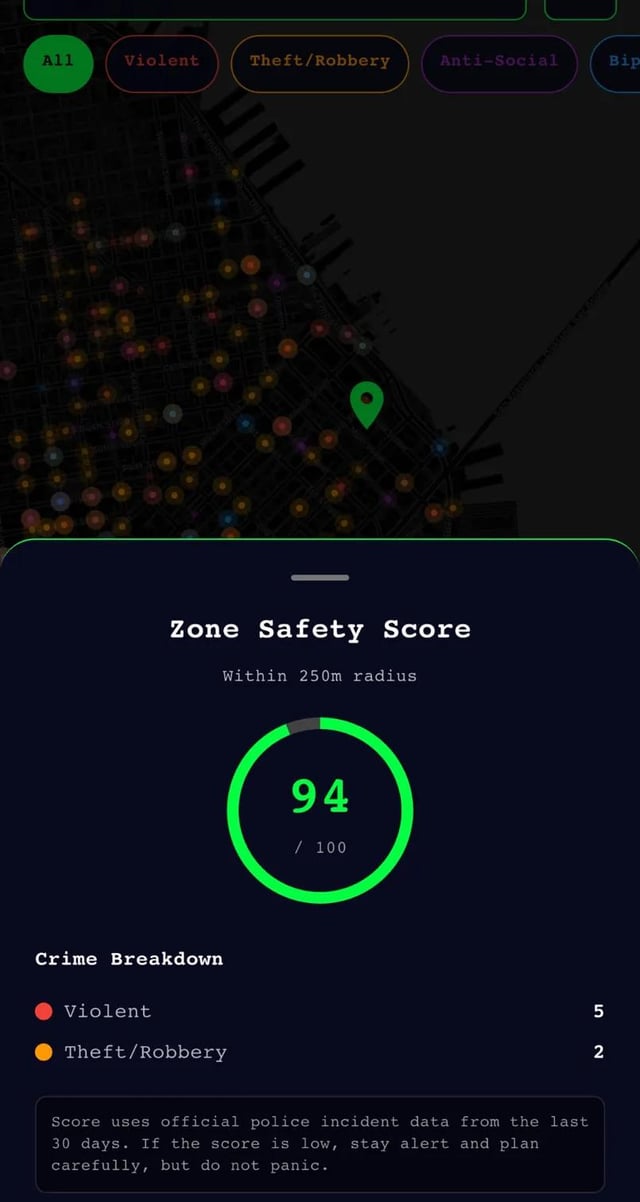
- 250m radius around any point you search
- Incidents weighted by distance closer = higher impact on score
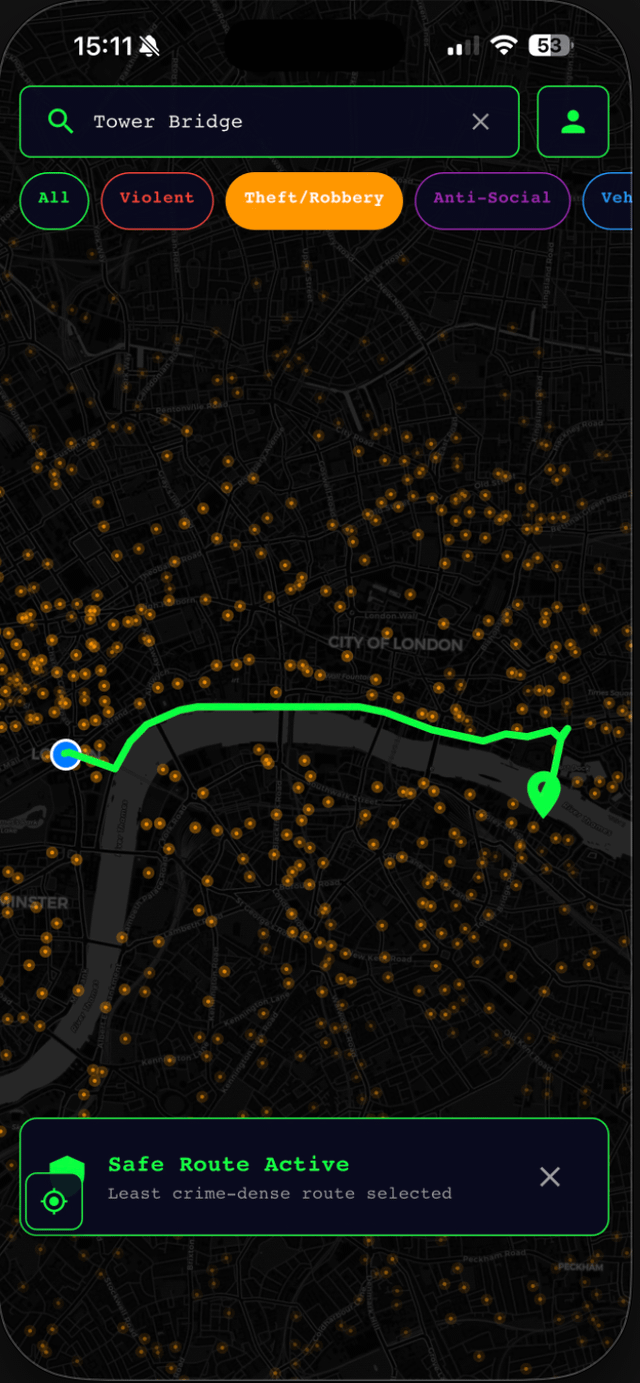
- Weighted by crime category violent incidents score higher than theft or anti-social
- Rolling last 30 day
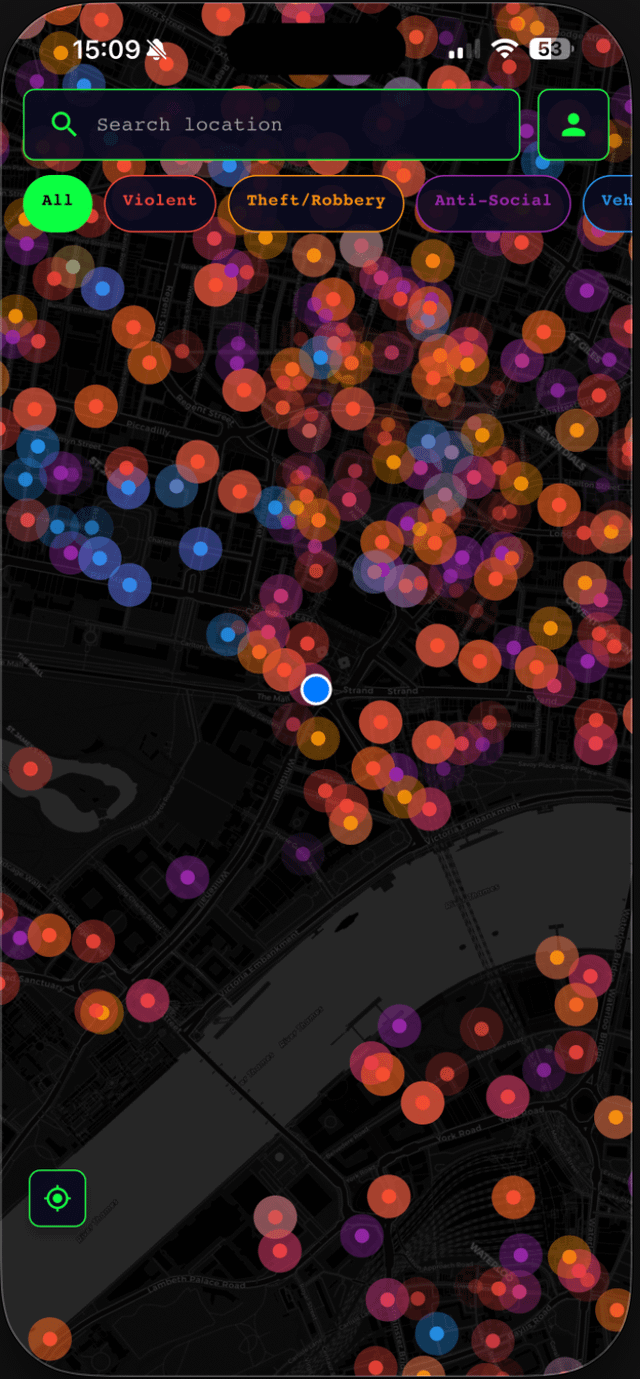
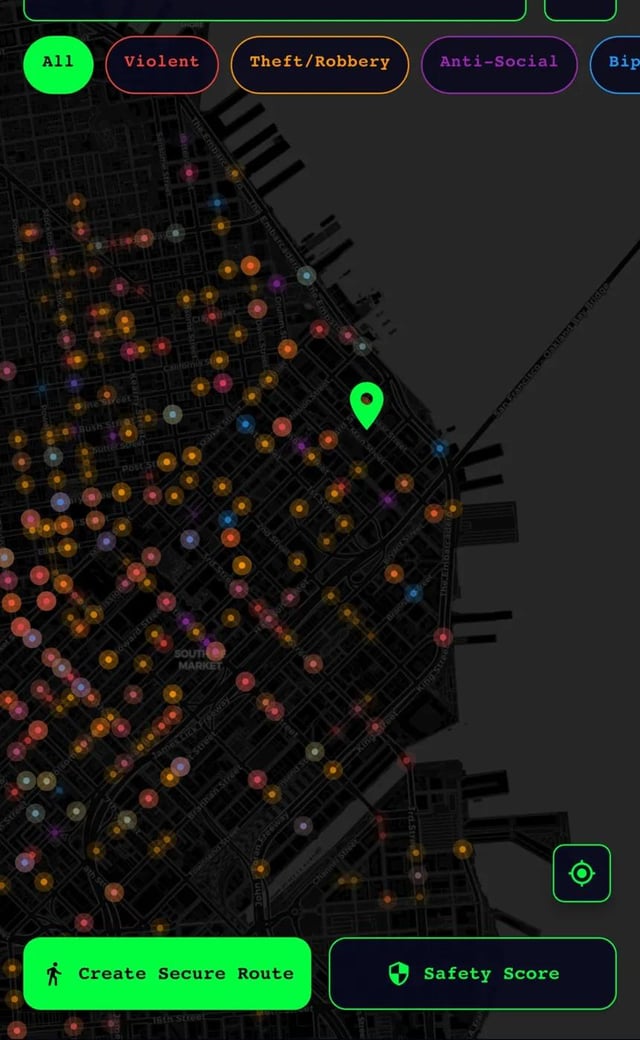
The heatmap is the raw visualization. The score condenses it into a single number out of 100.
Currently live in San Francisco, Chicago and London all three have clean, open police APIs.
I looked into expanding to other cities. Here's what I found:
Likely doable: NYC and LA both have solid open data portals, APIs are clean enough.
Messier: Toronto has open data but current year incidents aren't available for download yet. Sydney data exists but only at neighborhood level, not block level. Berlin just started publishing daily crime data in June 2025 but location precision is limited to planning districts, not street level.
What cities would you actually want to see added?
by Early_Cantaloupe7153
7 Comments
This is super cool, are you looking for users at this point? I’ve often thought about something like this, you say real time – is time of day taken into account? An area could be perfectly fine during the day you just wouldn’t want to be around there at night.
Source: SFPD Open Data, Chicago Data Portal, UK Police API | Tool: Custom iOS app
Is this a map of safety or a map of where policing is? Because you’re going to get heavy weighting towards areas police frequent or consider a priority to respond to. This has long been the issue with policing and crime data in general.
maybe combine them in heat maps or blocks, right now its a big colourfull christmas tree and i cant see shit
Have you thought about showing historical trends? May be a interesting thing to show if a area is trending towards getting better or getting worse and how things like regulation and changes in leadership change crimes/enforcement.
Sounds like a cool project! If you’re thinking about expanding to other cities, check if they have open data initiatives. Many cities do, but the quality and update frequency can vary. You might want to reach out to local government data portals or civic tech communities in those areas for insider tips. Also, talking about the scoring and visualization could be really useful in interviews, especially for data analysis or urban planning roles. If you’re getting ready for interviews, [PracHub](https://prachub.com?utm_source=reddit) is a good place for mock scenarios or brushing up on your skills. Let us know if you add any new cities!
Now I know where to get the good stuff