
I analyzed the top 5,000 most-starred GitHub repositories from 2019 to 2025 to see if AI tools actually changed how we write code documentation. The answer is yes. Here are the key findings from 35,000 top-tier repos:
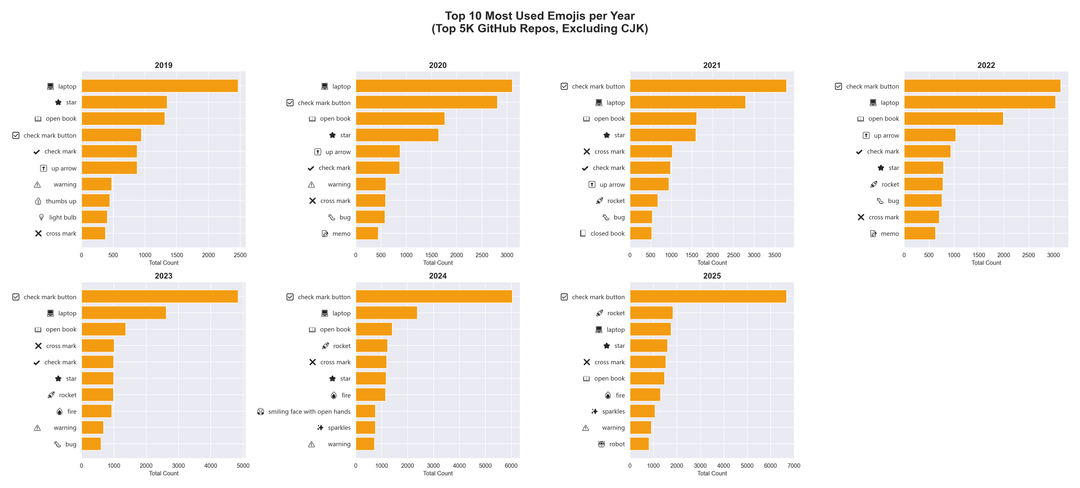
The "Sparkles" Era
Pre-AI (2019–2021) top emojis were utilitarian: 💻, ⭐, ⚠️. By 2024, the rocket (🚀) and the sparkles (✨) completely took over as the hallmark of AI hype-speak.
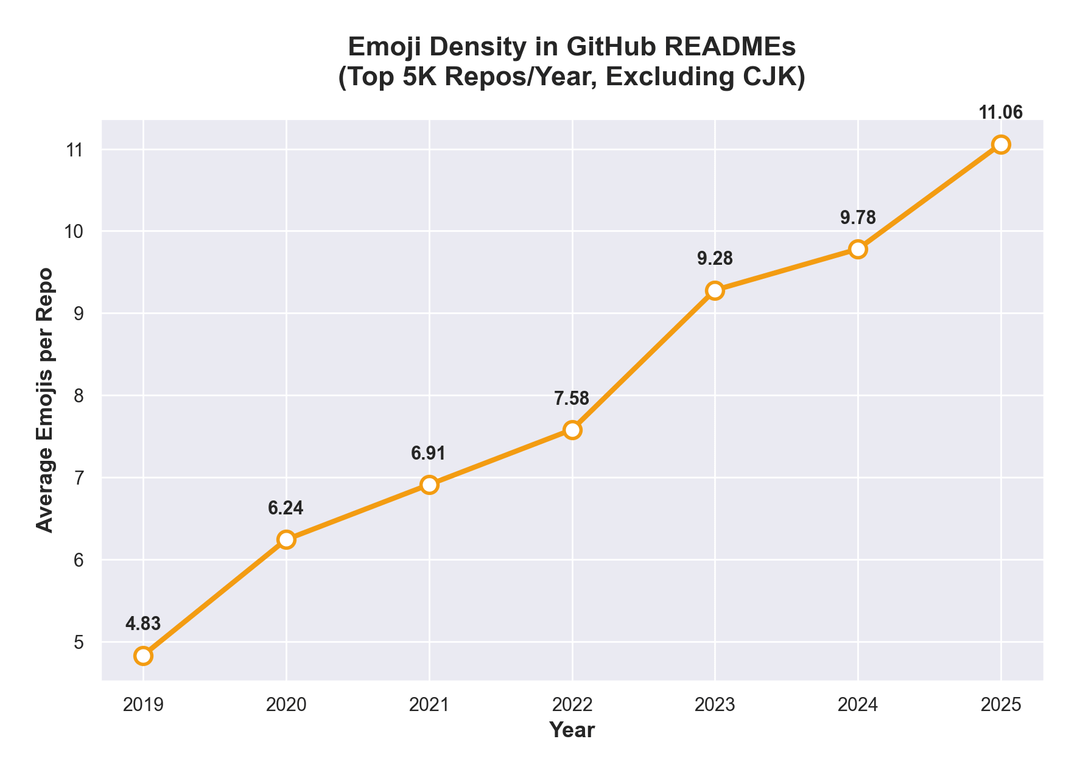
Emojis Are Everywhere
Emoji density skyrocketed by 130%. AI models default to formatting lists with emojis, dragging the average from 4.8 emojis per repo to over 11.
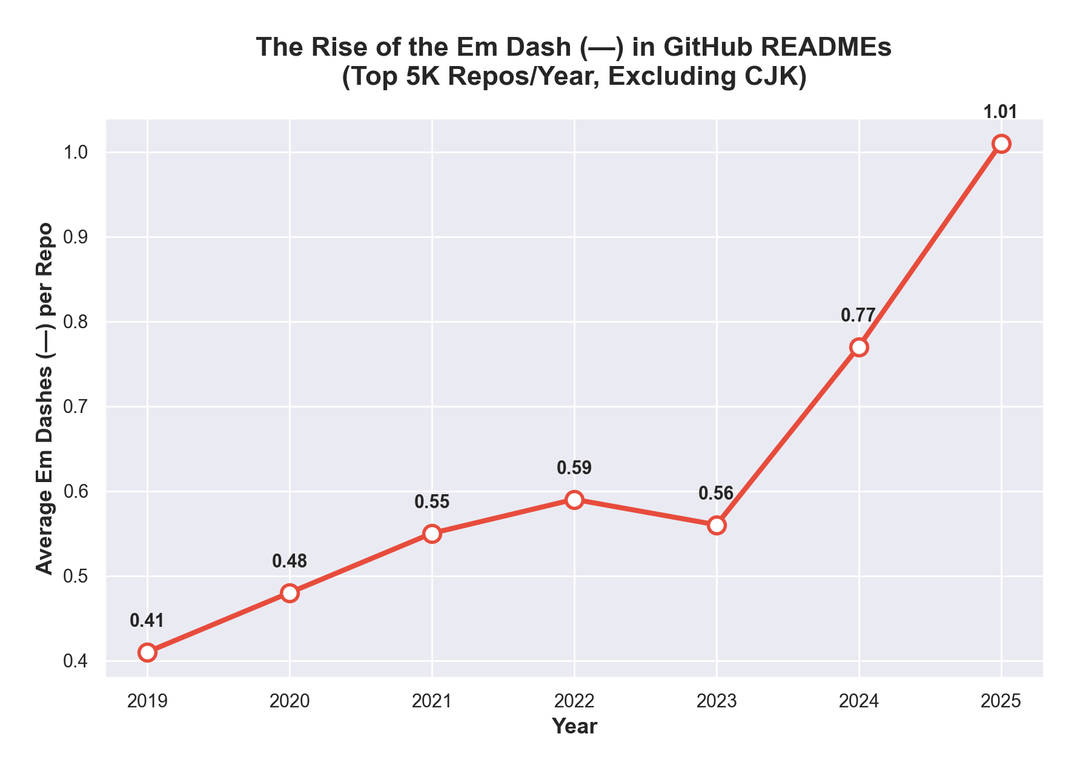
The "Em Dash" Explosion
Generative AI loves the "em dash" (—). In 2019, the average repo used 0.41 em dashes. By 2025, that jumped to 1.01 (a 146% increase).
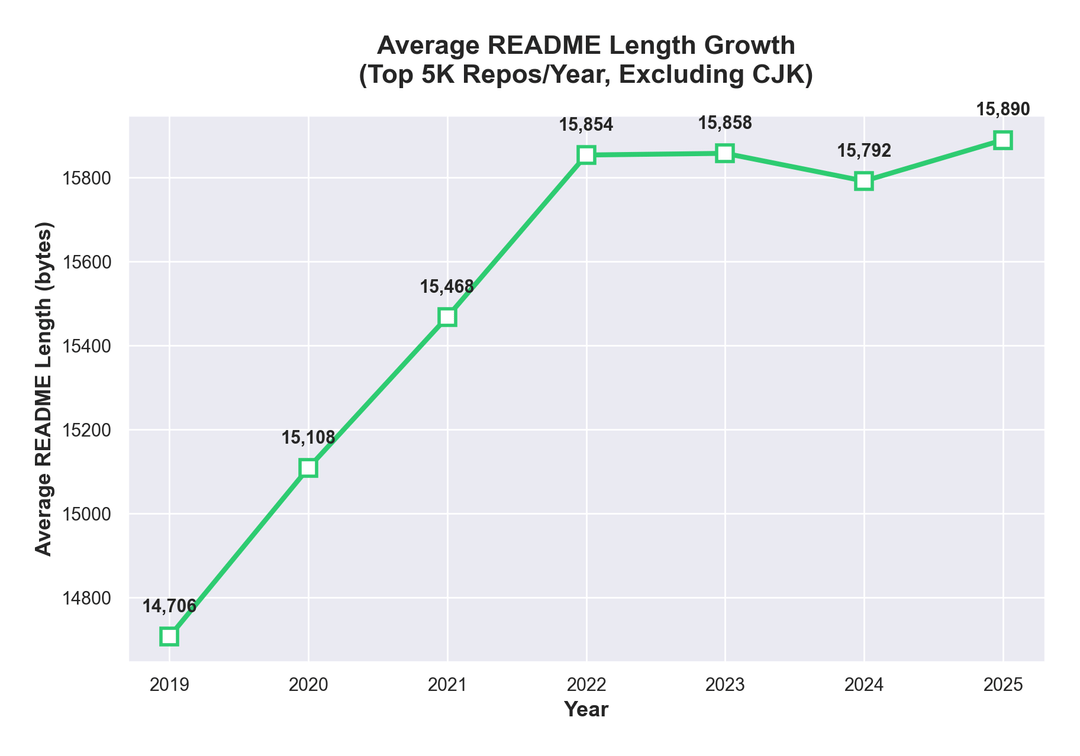
Bloat
It now takes 5 seconds to generate an entire setup guide. Because of this, the average README size grew by ~1,000 bytes (8%).
Methodology
Data sourced via Google BigQuery (identifying the top 5k most-starred repos each year) and parsed using a Python script that sent exactly 35,000 HTTP requests to raw.githubusercontent.com.
Full write-up : https://medium.com/@srkorwho/i-analyzed-35-000-github-readmes-to-see-if-ai-changed-how-we-write-code-documentation-6e8715a4f43c
by Mean-Sink6996
6 Comments
Nice overview, just one criticism: your first graph really suffers from the Y-axis truncation. It’s fine for the other graphs, as the ordinate displays a reasonable value range, but for the first one it makes it seem like a very small (<10%) difference is substantial.
How did you come to that emoji conclusion? Pre-LLM emoji usage trendline seems to agree with the increase in usage.
Cool data, it’s really interesting that a lot of these trends were in place, pre-LLM explosion, and LLMs just accelerated them.
However I don’t agree with this interpretation:
> It now takes 5 seconds to generate an entire setup guide. Because of this, the average README size grew by ~1,000 bytes (8%).
LLMs weren’t really being used for README generation widely until 2023 and onward. If anything, we see that there was already a trend of increasing README lengths prior to the introduction of LLMs and LLMs actually halted this.
Curious what data looks like before 2019. Is it relatively stable and thus not really worth showing?
Y axis range is 14800 to 158000. Just a 1000 byte difference. I think the difference is explained by heavy use of emoji?
GPTs are statistical models so it’s unlikely go over or below pre AI era average README lengths unless specifically prompted to do so by a human.
LLM produced READMEs are way to verbose and unreadable in my opinion. Better than empty READMEs I guess.