
Source Data:
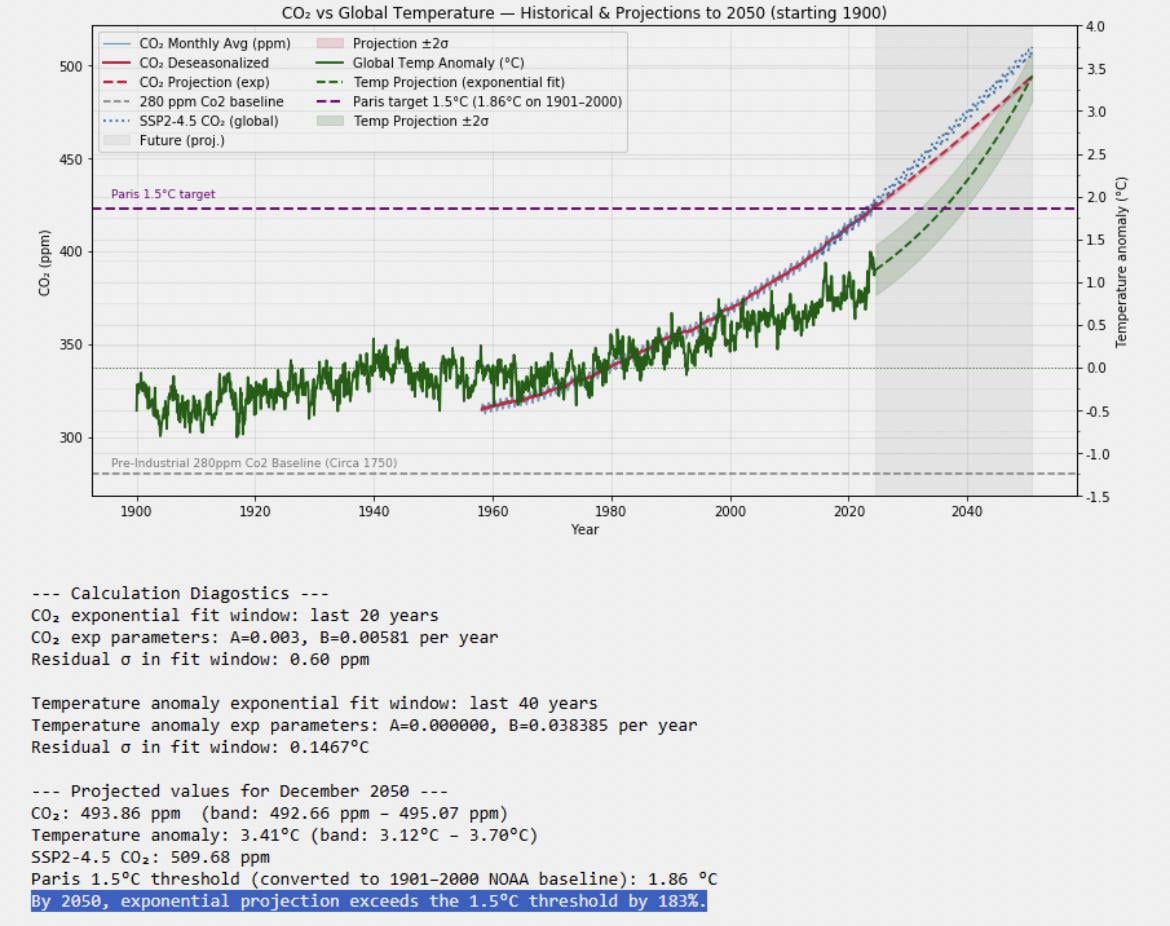
Historical CO2: https://gml.noaa.gov/webdata/ccgg/trends/co2/co2\_mm\_mlo.csv
Historical Temperature Anomaly: https://datahub.io/core/global-temp/r/monthly.csv
– baseline temperature is 1901-2000 aggregated global average
SSP2-4.5 CO2: University of Melbourne “Greenhouse Gas Concentrations” portal
by GotPoopWeScoop
1 Comment
If you post this in Wall Street bets, they’ll upvote you simply because the chart is going up and to the right.