
This is an interactive 3D visualisation of a real mycorrhizal fungal network mapped by researchers in a 30x30m Douglas fir forest plot in British Columbia.
What you're seeing:
– 67 trees connected by 220 fungal links through 27 distinct fungal organisms (genets)
– The largest hub tree ("mother tree") has 47 connections — linked to 70% of the plot
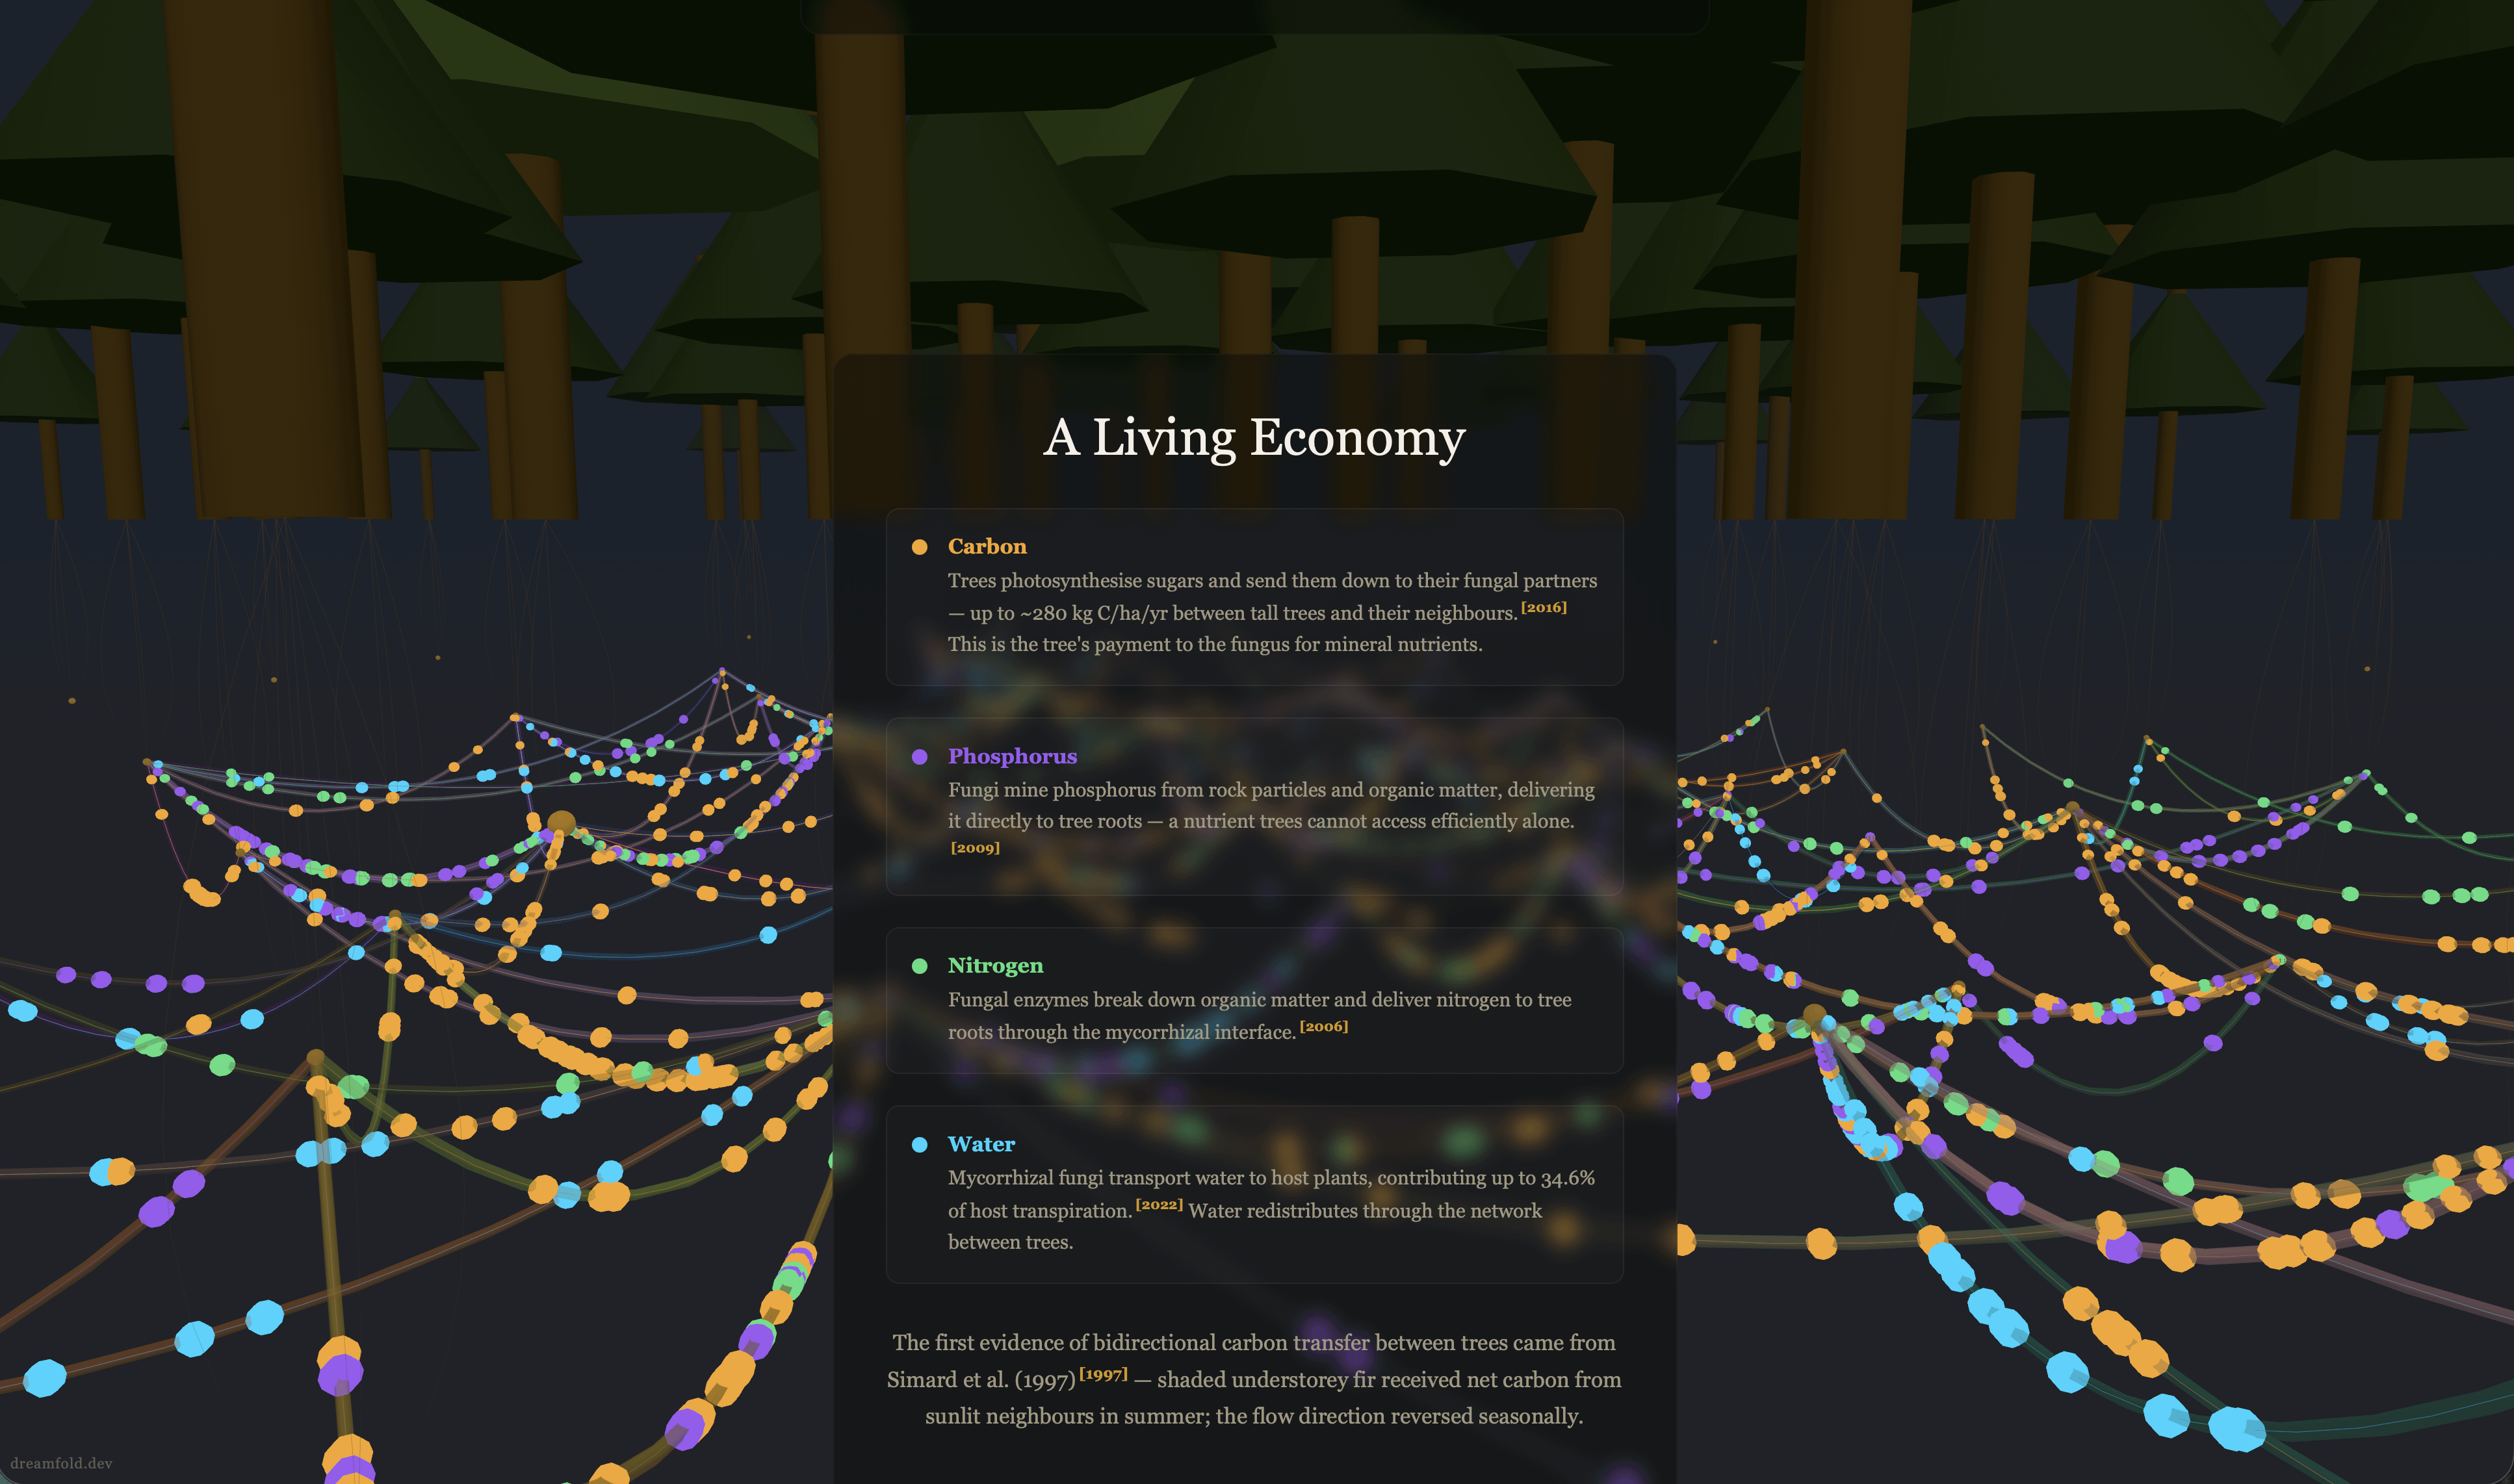
– Fungi trade carbon, phosphorus, nitrogen, and water between trees — the direction and volume shifts with the seasons
– Veteran trees are net carbon donors; saplings are net receivers
– Some connections are scientifically well-established (green edges), others are demonstrated but debated (amber), and a few are contested (red)
Interactive features:
– Scroll through a 7-section narrative explaining the science
– Then switch to explore mode: toggle nutrient types, change seasons, click fungal genets to highlight entire organisms, Shift+click a tree to trigger a defence signal cascade through the network
– Confidence overlay shows evidence strength for each connection
by darryl-c
2 Comments
*Data* *source:* *Beiler* *et* *al.* *(2010)* *”Architecture* *of* *the* *wood-wide* *web”* *and* *Beiler* *et* *al.* *(2015),* *mapping* *multi-species* *fungal* *networks* *via* *genotyping* *of* *root* *tips.* *67* *Douglas* *fir* *trees,* *27* *Rhizopogon* *genets,* *220* *edges.* *Dataset* *enhanced* *with* *cohort* *classifications,* *depth* *ranges,* *nutrient* *directionality,* *and* *confidence* *levels* *derived* *from* *Simard* *et* *al.* *(1997,* *2012),* *Klein* *et* *al.* *(2016),* *and* *16* *other* *peer-reviewed* *papers* *cited* *in* *the* *app’s* *sources* *panel.*
*Tools:* *React* *19,* *Three.js* *(via* *React* *Three* *Fiber),* *TypeScript,* *Zustand,* *Vite.* *Graph* *layout* *computed* *from* *the* *original* *spatial* *coordinates* *with* *force-directed* *edge* *routing.* *All* *rendering* *runs* *client-side* *—* *no* *backend.*
Really love this presentation! Out of curiosity, do you know which forest in BC the data comes from?