
Source: Real purchase data from Norwegian online grocery store Oda, tracked via Odalytics — a browser extension I built that analyzes grocery order history across households.
Tools: Python, Plotly, PostgreSQL (Supabase)
Dataset: 10,416 unique products, 142,827 daily price observations, 4,867 orders from real Norwegian households (2014–2026).
What you're seeing:
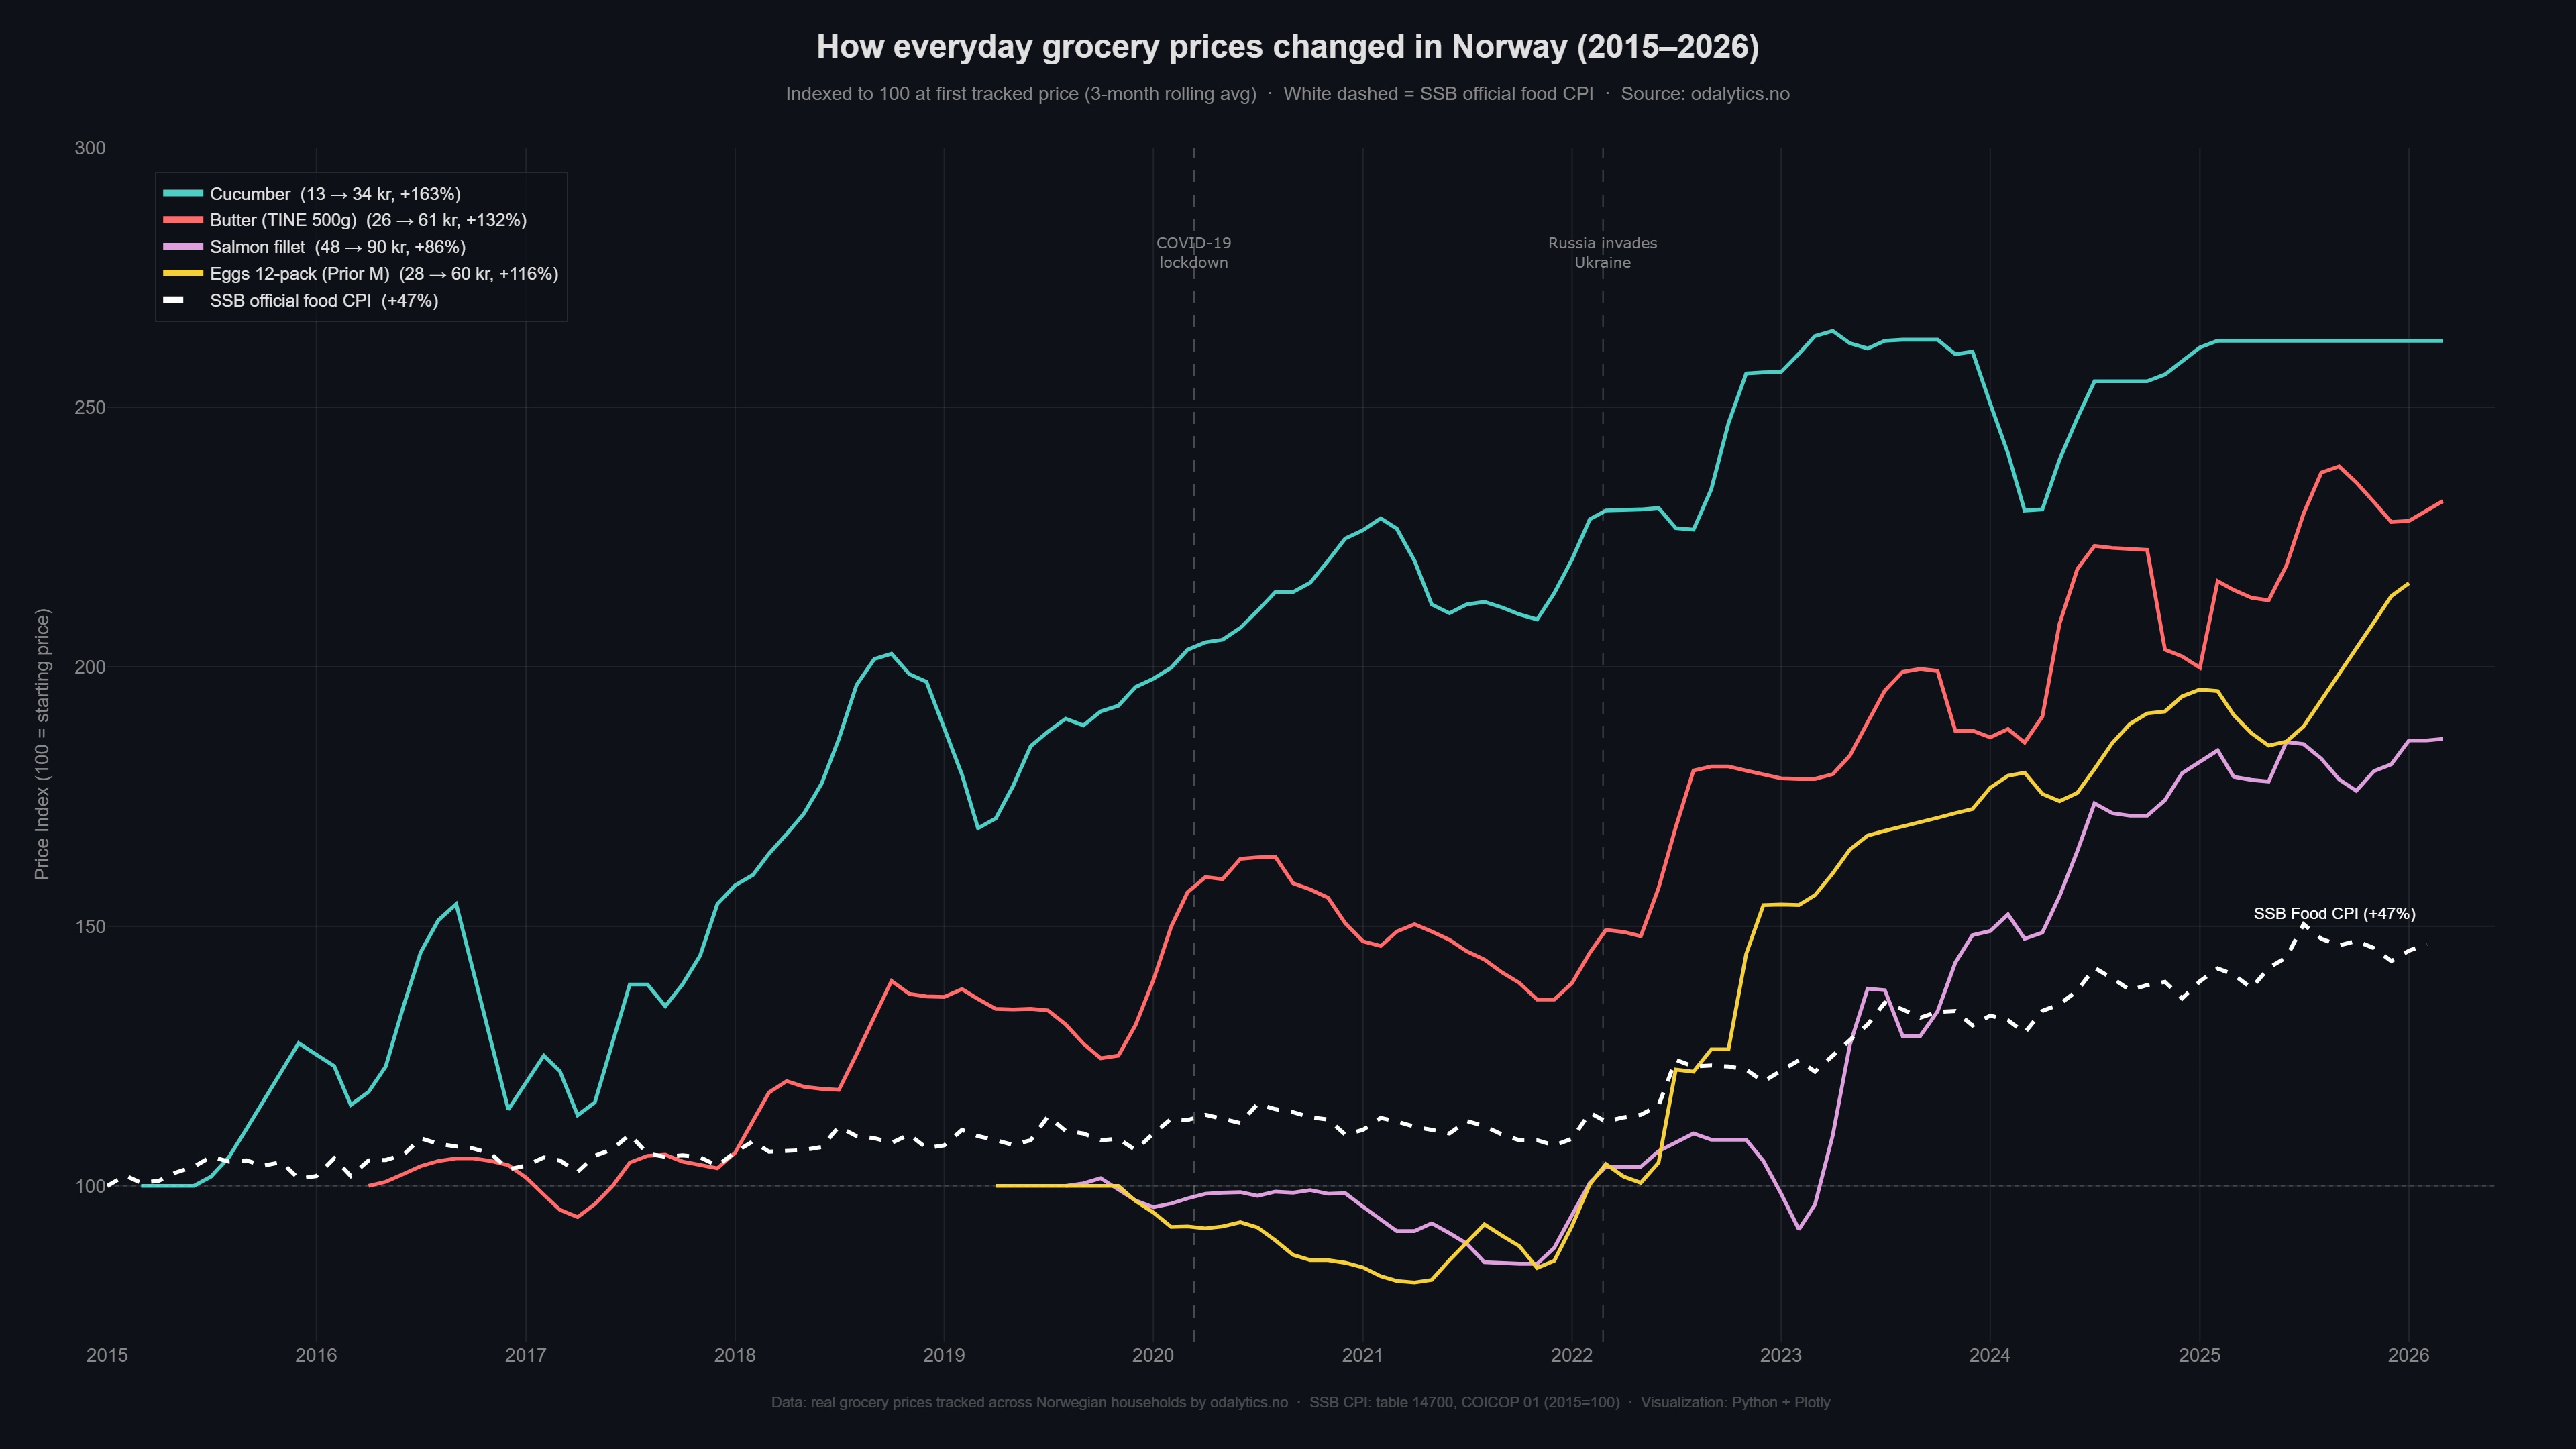
Each line shows how the price of an everyday grocery staple has changed relative to its starting price, indexed to 100 (3-month rolling average). The white dashed line is Norway's official food CPI from Statistics Norway (SSB), also indexed to 100 at January 2015.
Key findings:
- A single cucumber went from 13 kr to 34 kr — up 163% since 2015
- Butter (TINE Meierismør 500g, Norway's #1 brand) rose from 27 kr to 62 kr — up 132% since 2016
- A 12-pack of eggs more than doubled: 28 kr → 60 kr (+116% since 2019)
- Salmon fillets (4pc): 48 kr → 90 kr (+86% since 2019)
Meanwhile, the official SSB food CPI rose 47% over the same period. Individual staple prices have outpaced official food inflation by 2–3.5x.
Why the gap? CPI is a weighted basket that includes substitution effects (people switching to cheaper brands), quality adjustments, and category reweighting. Individual staple products with no close substitutes — like butter or eggs — can rise much faster than the aggregate index suggests.
For context: 1 NOK ≈ 0.09 USD / 0.085 EUR. Norwegian grocery prices are among the highest in Europe (although relatively low when compared to salaries).
Other data we have beyond prices:
- CO₂ emissions per product using the Danish Climate Database (10,416 products mapped), so users can track their carbon footprint
- Ultra-processed food (NOVA classification) — every product classified on the NOVA 1–4 scale, so users can track their spend on ultra-processed food (NOVA 4)
- Country of origin — where each product is actually produced, so users can track which economies they support
Happy to answer any questions about Norwegian grocery prices!
by odalytics