
Source: U.S. Census Bureau state-to-state migration tables, annual data for 2021 to 2024:
https://www.census.gov/data/tables/time-series/demo/geographic-mobility/state-to-state-migration.html
Tools: Python for data prep, JavaScript/D3 with HTML/CSS for the choropleth design, and Playwright/Chromium for the high-resolution PNG export.
If you want to remix it, check the code, or recalculate it a different way, the full project is here:
https://github.com/willsigal/state-migration-analysis
A lot of people on my original post asked for per-capita views rather than just raw net migration counts, so I redid the maps three ways and included all three:
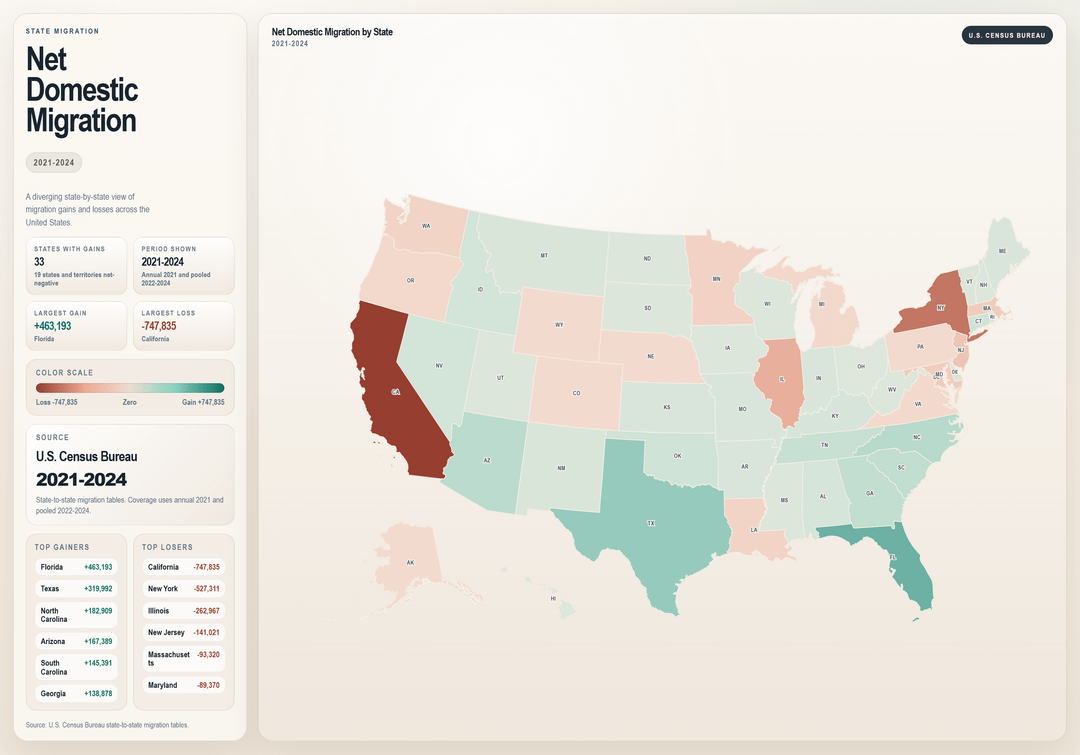
- original cumulative net domestic migration counts for 2021 to 2024
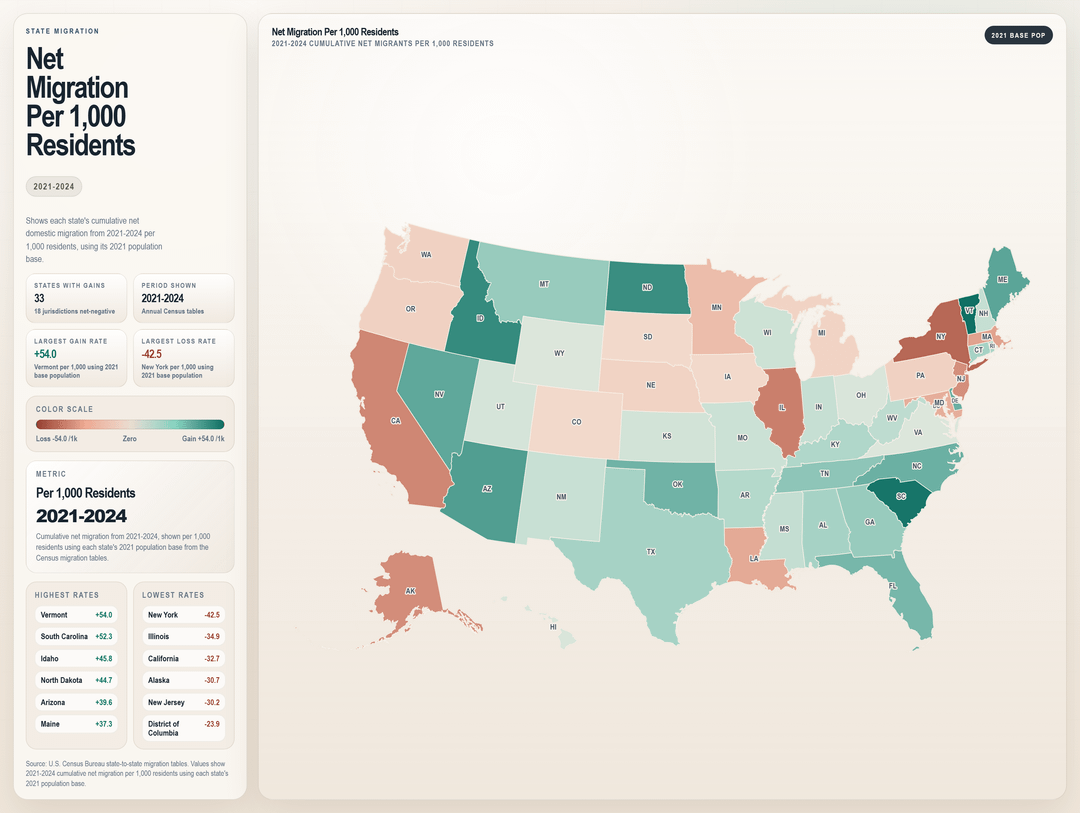
- cumulative net migration per 1,000 residents
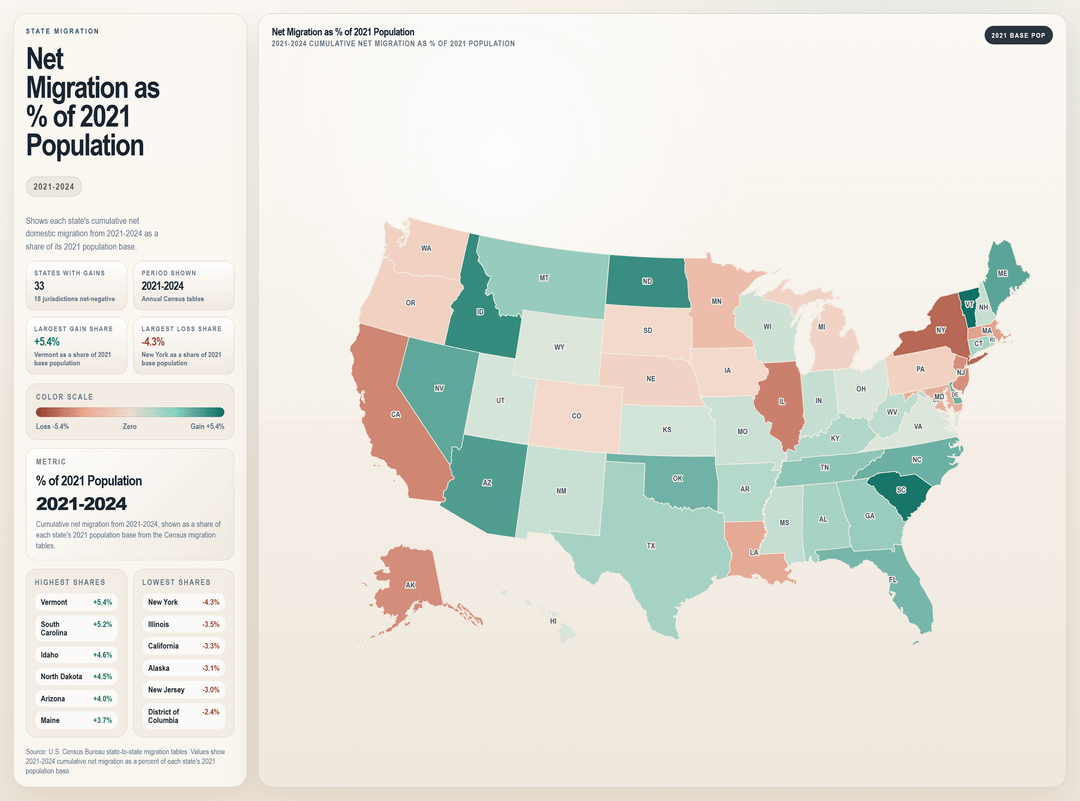
- cumulative net migration as a % of each state’s 2021 population (same story as #2)
For the normalized versions, I used each state’s 2021 population as the baseline. The migration data come from the U.S. Census Bureau’s State-to-State Migration Flows tables, which are based on ACS 1-year data. Population values were taken from the same Census migration source and indexed to 2021 for the denominator. P.S. I'm born raised and love California so not trying to post anything deceptive. Just wanted to make something with the State-to-State migration tables. Let me know what I could do better.
by Live-Fan-7661
1 Comment
Thank you for this.
No matter how you slice it, the truth is a lot of people left NY/CA in the past few years and southern/other states gained residents.
I’d be curious to see how this holds up before 2021. Perhaps a look back to 2014-2024 may interesting (10 year span).
EDIT: Vermont is a pretty big shocker here too. It’s a lovely state, but crazy to see the change.