
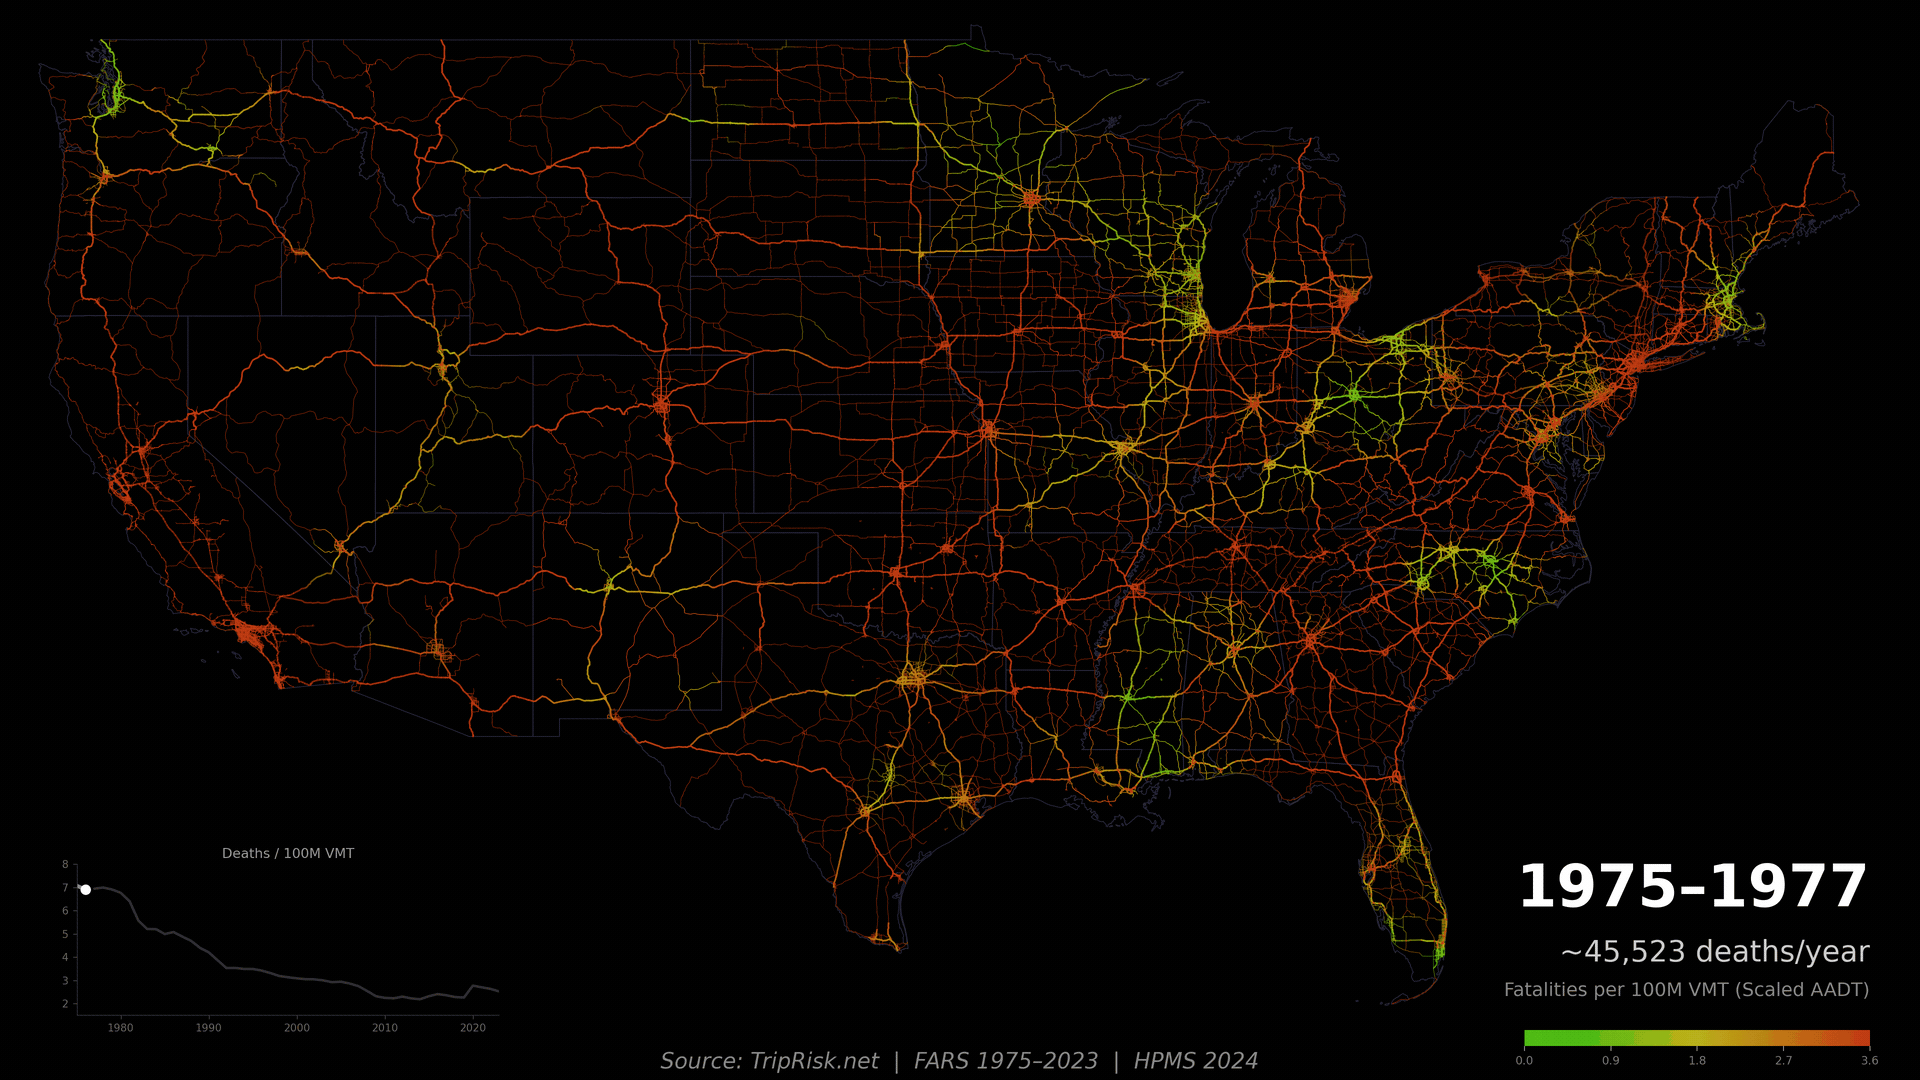
The normalized fatal risk across US highways has decreased significantly over the last 50 years.
Fatal crash locations from NHTSA's Fatality Analysis Reporting System (FARS, 1975-2023) were snapped to major road segments (Interstate, Freeway, and Principal Arterial) from the 2024 Highway Performance Monitoring System (HPMS). Each frame shows a 3-year rolling average of the fatality rate per 100 million vehicle miles traveled, with historical traffic volumes estimated by scaling 2024 HPMS AADT using state-level VMT ratios from FHWA Highway Statistics. Risk values were spatially smoothed with a 0.15-degree Gaussian kernel.
1.8M fatal crash records, 2M total deaths, 180M segment-level data points
by jejmcjej
4 Comments
Notice the first couple of years deaths and the last couple are about the same (43k+). I’m assuming the number of miles drove really increased in the time frame
What’s going on in California for it to be so bad there?
That’s pretty interesting. There is a clear regional pattern, makes me wonder what was happening
… only 3 upvotes? This thing looks like the kind of thing I’d see with like 30k upvotes woah