
Hi everyone!
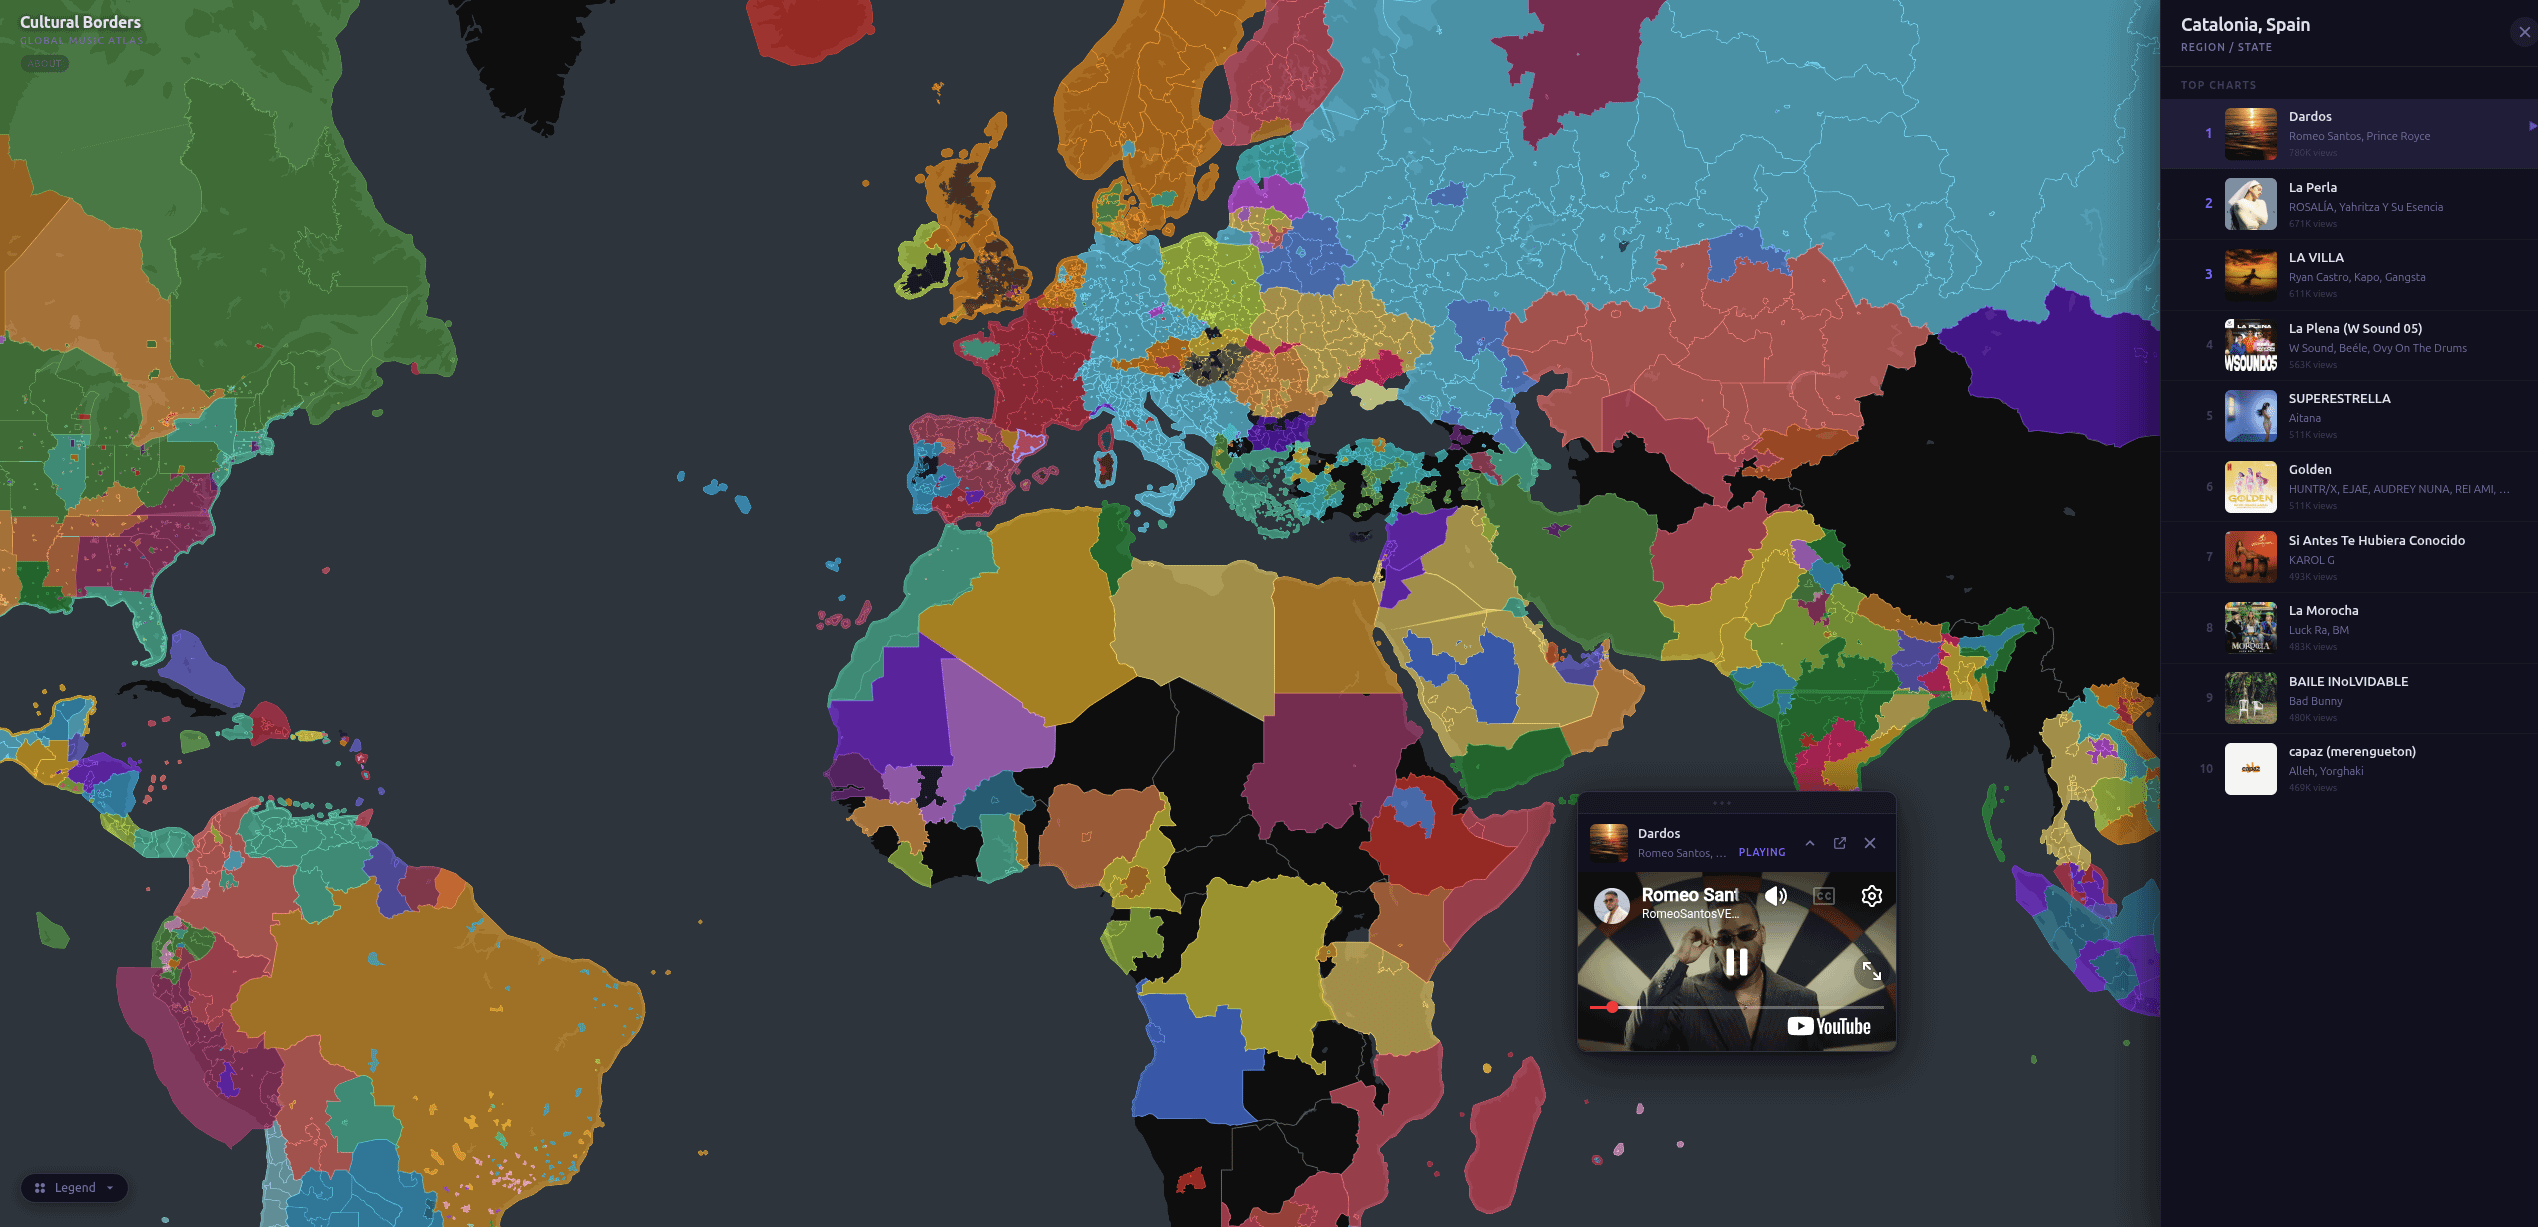
I’ve always been fascinated by how music transcends (or reinforces) physical borders. Inspired by the original "Cultural Borders" project by The Pudding, I wanted to create a version that wasn’t just a static snapshot, but a live, hierarchical geography of music.
Link to the project: https://catbru.github.io/cultural-borders-yt-charts-web/
by cat_bru
3 Comments
**How I built it (The “Beautiful” Data part):**
* **Data Sources:** Music data is fetched via YouTube Charts APIs. Map geometries are sourced from OpenStreetMap (Nominatim).
* **Data Pipeline:** I built a pipeline using **Python and GeoPandas** to discover locations via autocomplete APIs and fetch chart data in parallel (using 10 parallel workers to handle the ~90k rows of data).
* **Frontend:** The map is rendered using **MapLibre GL JS**, handling the `combined_map.geojson` and `charts_tracks.csv` files on the fly. I used topological simplification to ensure the map remains performant on web browsers.
**Key Features:**
* **Granularity:** Unlike most music maps that only show countries, this includes ~4,700 locations including cities and sub-regions.
* **Beyond #1:** You can explore the full Top 20 context for each specific territory.
* **Non-overlapping Geometry:** I used a custom global geometry that preserves local specificity while allowing instant interaction.
But the colours, what do they mean?
Interesting that the Brazilian Phonk artist (ZXKAI) is #1 all over Russia but not even charting in Brazil itself.
One of the few actual good posts from this sub. Cool project.