
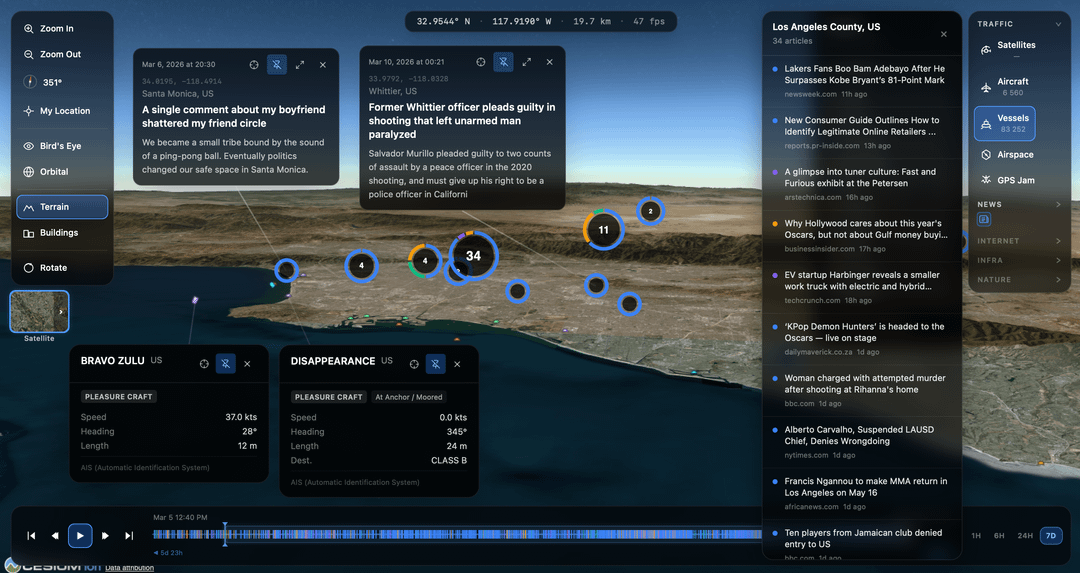
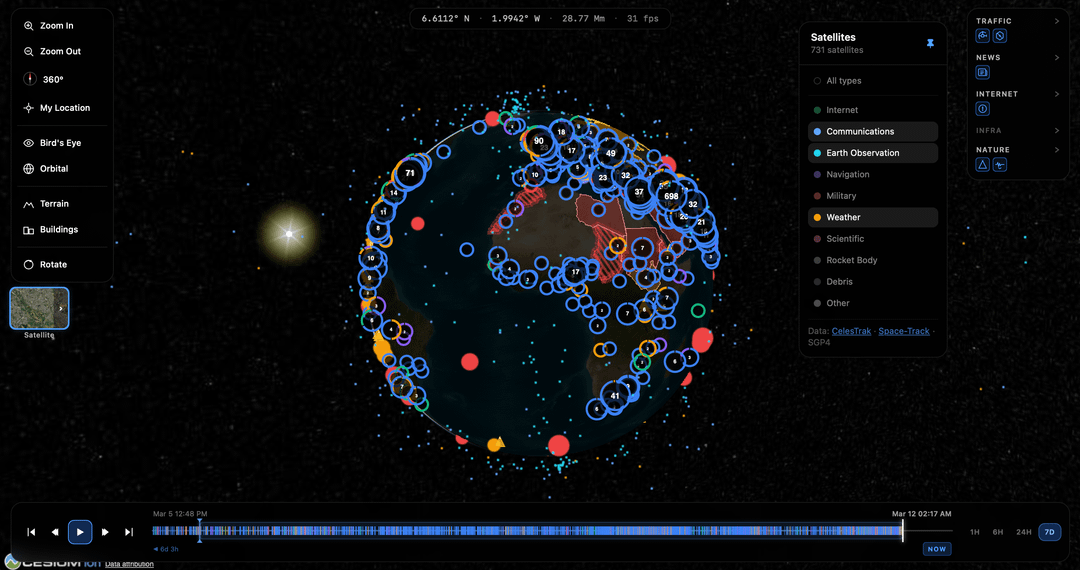
Solo project, built in about 5 days. I wanted one place to see the physical and digital infrastructure of the world moving in real time — not a conflict tracker, not a news feed, just the systems that keep everything running.
What's live right now:
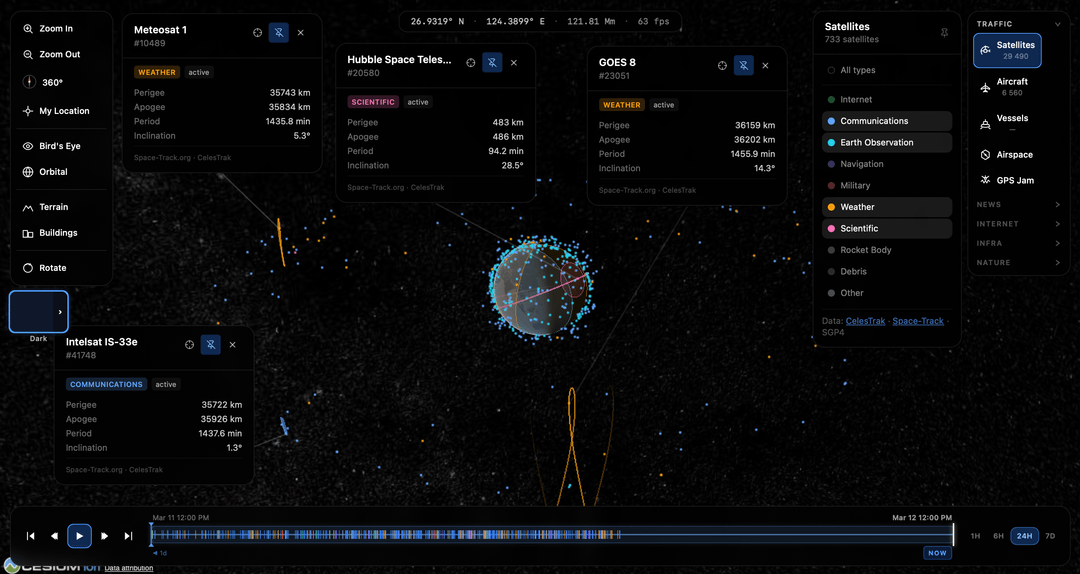
– ~25,000 satellites (TLE-based, Cesium-rendered orbits)
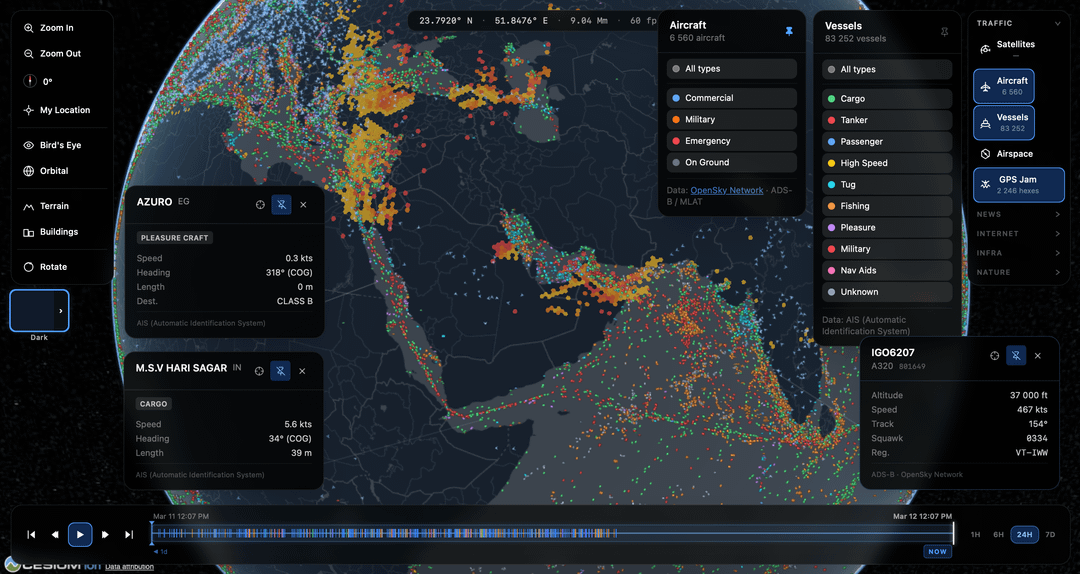
– Live commercial & military aircraft (OpenSky Network)
– Vessel traffic (AISStream)
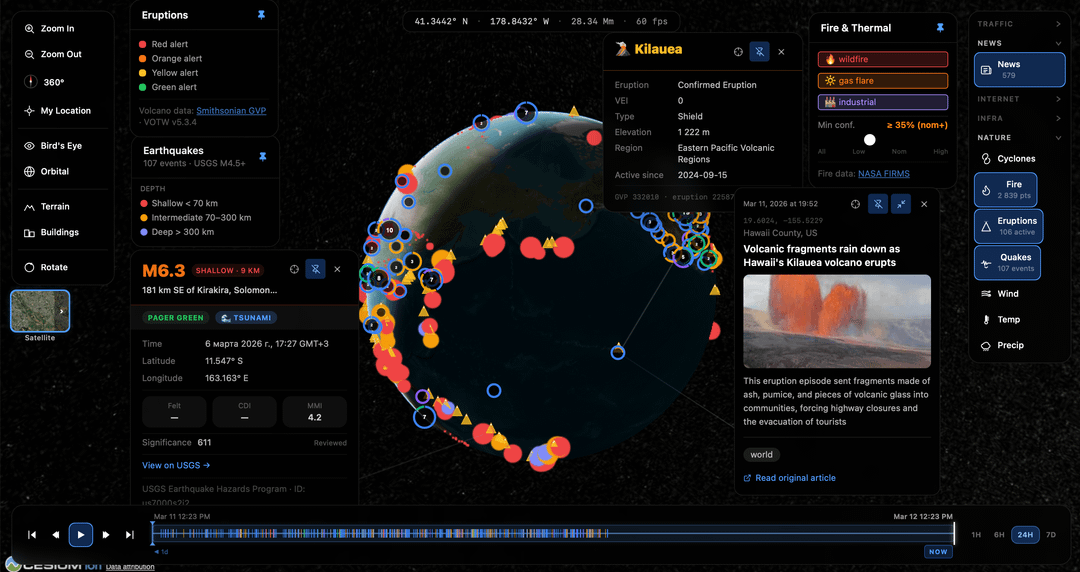
– Fire hotspots (NASA FIRMS)
– Active volcanoes & eruptions (Smithsonian GVP)
– Earthquakes (USGS)
– Active cyclones (RAMMB/SLIDER)
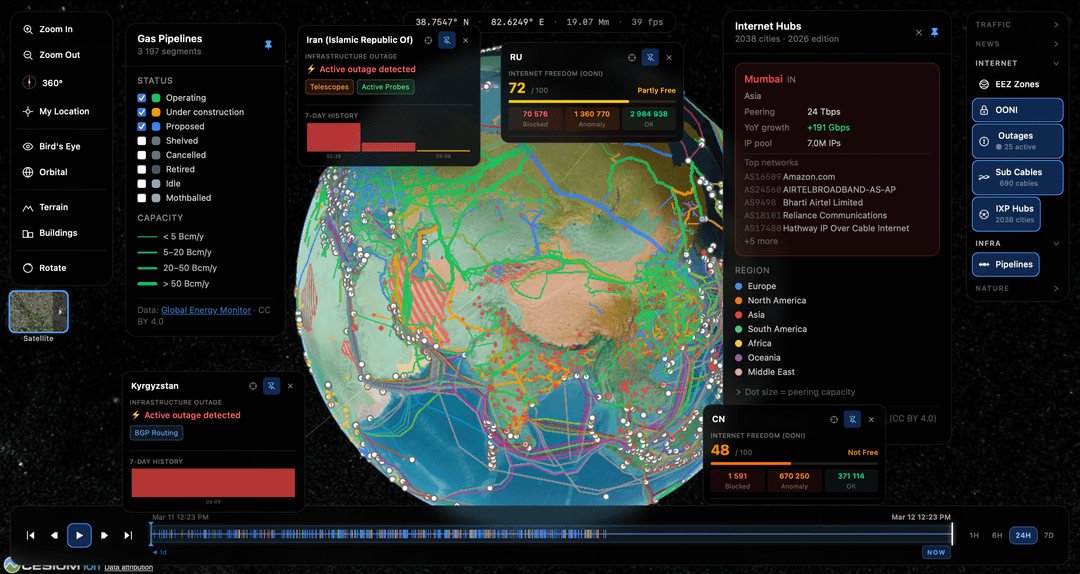
– Internet outages (IODA)
– Submarine cables & landing points
– Gas pipeline network
– GPS jamming/spoofing zones
– Airspace restrictions & TFRs
– Internet Freedom Index by country
Built with: Cesium.js (globe), PostgreSQL + PostGIS, Python parsers for each data source, FastAPI backend.
Data sources: NASA, USGS, OpenSky Network, IODA (Georgia Tech), Smithsonian GVP, RAMMB, and various open government datasets.
Happy to answer questions
by EmergencyBox4977
11 Comments
is there a website where we can see it?
This is amazing ❤️. Looking forward for the URL!
Holy cow – this is awesome! Well done!
How do you sync things that update at totally different speeds?
Are you looking to open source this?
This is amazingly interesting! I can see me looking at this several times a day! Can’t wait to see the website. Great work!
The ultimate answer to: “What’s happening?”
Holy shit this is the coolest thing I’ve seen posted here.
4th image?
https://preview.redd.it/k2felcl0qlog1.png?width=238&format=png&auto=webp&s=c472eb4784166b55e3499523cad0493c00edffd1
Awesome.
Weather and industrial index coming next?
How long did it take to put it together and code it?
What’s your earthquake data source? Do you know what the most fast updating ones are? I have polymarket logic to support. 😀
This is amazing.. seriously cannot wait to see it in action.