Paris publishes its budget data as raw CSVs and PDFs. We built an open-source platform that transforms this into interactive visualizations anyone can explore.
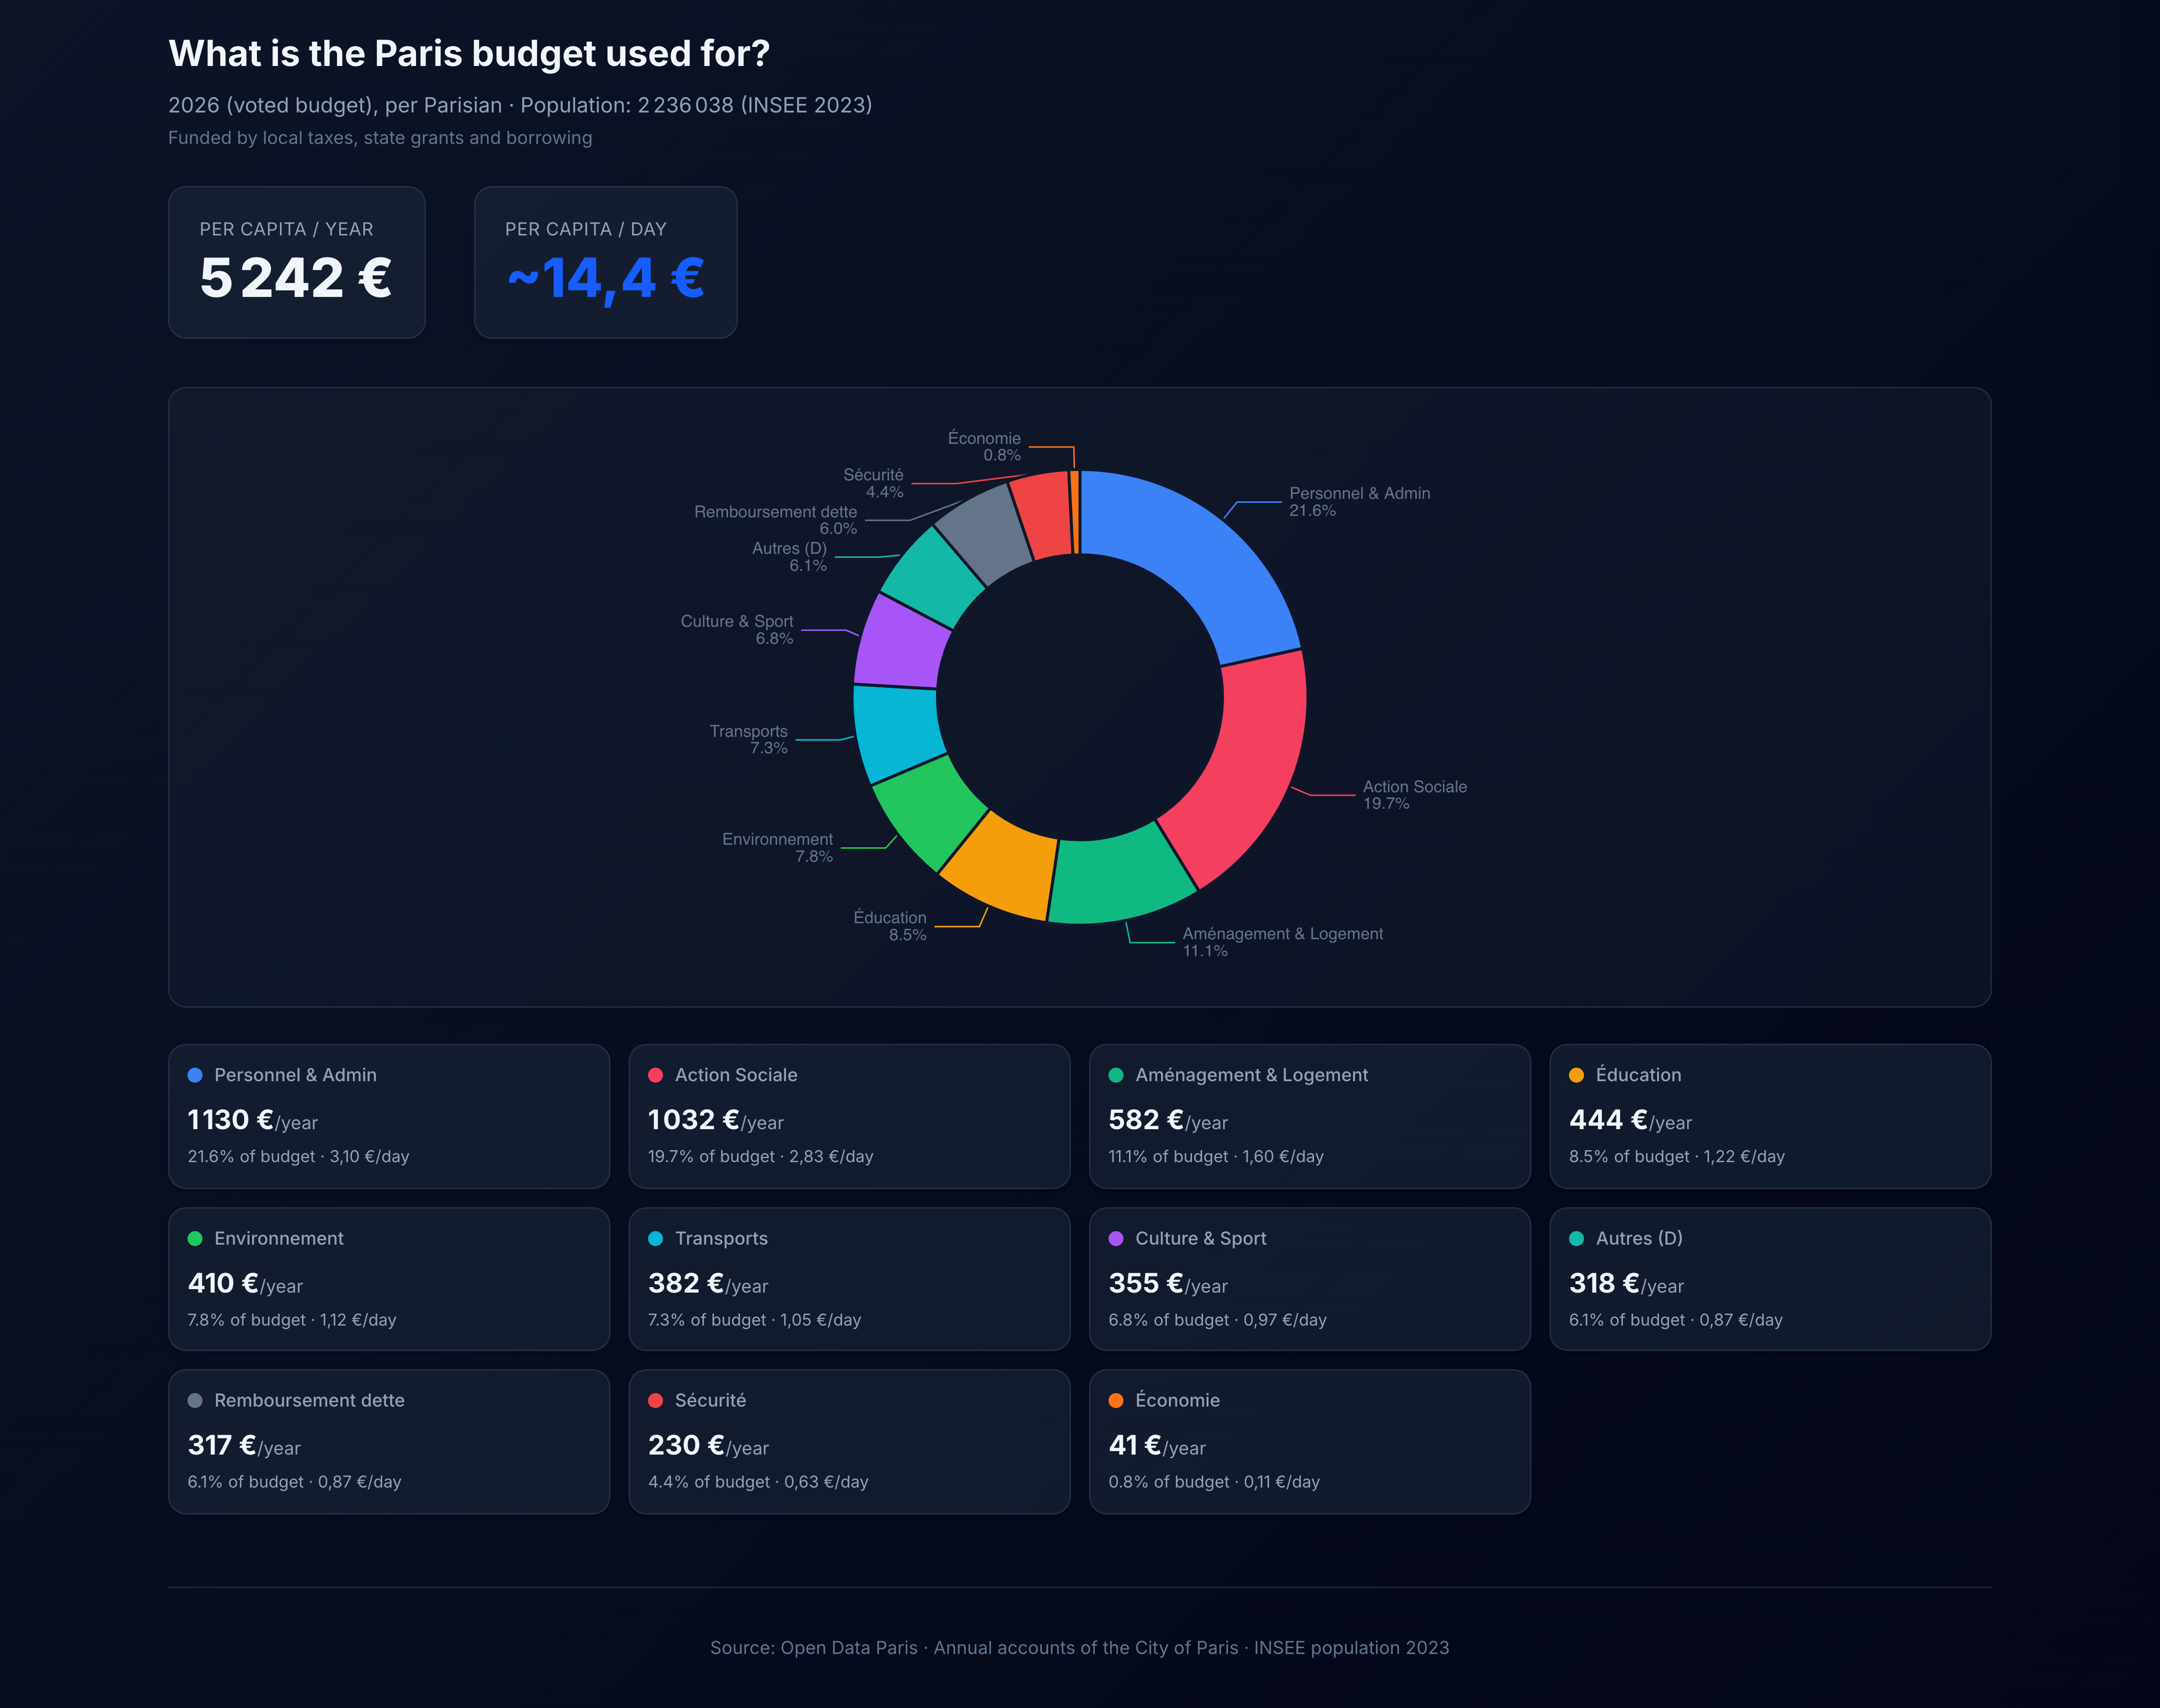
This chart breaks down the city’s budget into 11 thematic categories and shows how much each Parisian effectively “pays” per day. The biggest slices: personnel & admin, social services and urban planning.
Source: Open data from [opendata.paris.fr](http://opendata.paris.fr), processed through a dbt/BigQuery pipeline.

2 Comments
Paris publishes its budget data as raw CSVs and PDFs. We built an open-source platform that transforms this into interactive visualizations anyone can explore.
This chart breaks down the city’s budget into 11 thematic categories and shows how much each Parisian effectively “pays” per day. The biggest slices: personnel & admin, social services and urban planning.
Source: Open data from [opendata.paris.fr](http://opendata.paris.fr), processed through a dbt/BigQuery pipeline.
Tool: Next.js + Recharts, fully open source at [github.com/Nuttux/france-open-data](http://github.com/Nuttux/france-open-data)
Explore the full interactive version: [https://franceopendata.org/tableau-de-bord](https://franceopendata.org/tableau-de-bord)
Interesting, I wonder how that compares to cities like NYC or SF