OC] I analyzed 30M+ US domestic flights (2020-2024). Florida dominates the worst airports, airlines improved but delays got worse, and Southwest cancelled 1 in 7 flights in Dec 2022.
OC] I analyzed 30M+ US domestic flights (2020-2024). Florida dominates the worst airports, airlines improved but delays got worse, and Southwest cancelled 1 in 7 flights in Dec 2022.
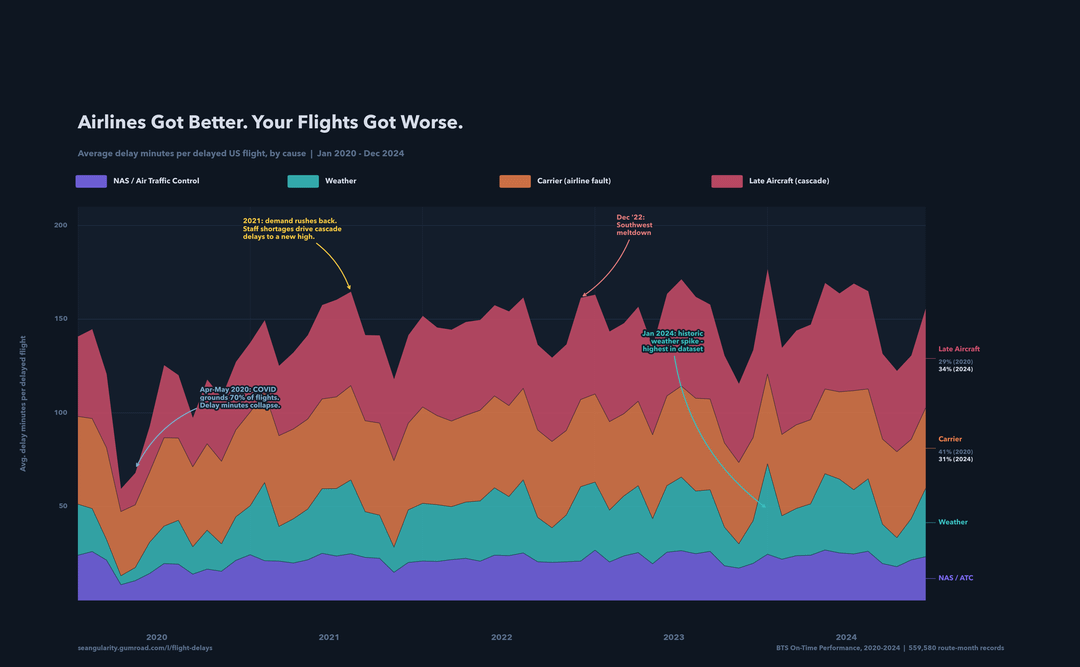
Chart 1 – Delay causes: Carrier delays (things airlines directly control) dropped from 41% of total delay time in 2020 to 31% in 2024. But the late aircraft cascade – one delayed plane making every downstream flight late – grew to fill the gap. Total delay minutes per delayed flight are higher now than before the 2021 demand surge.
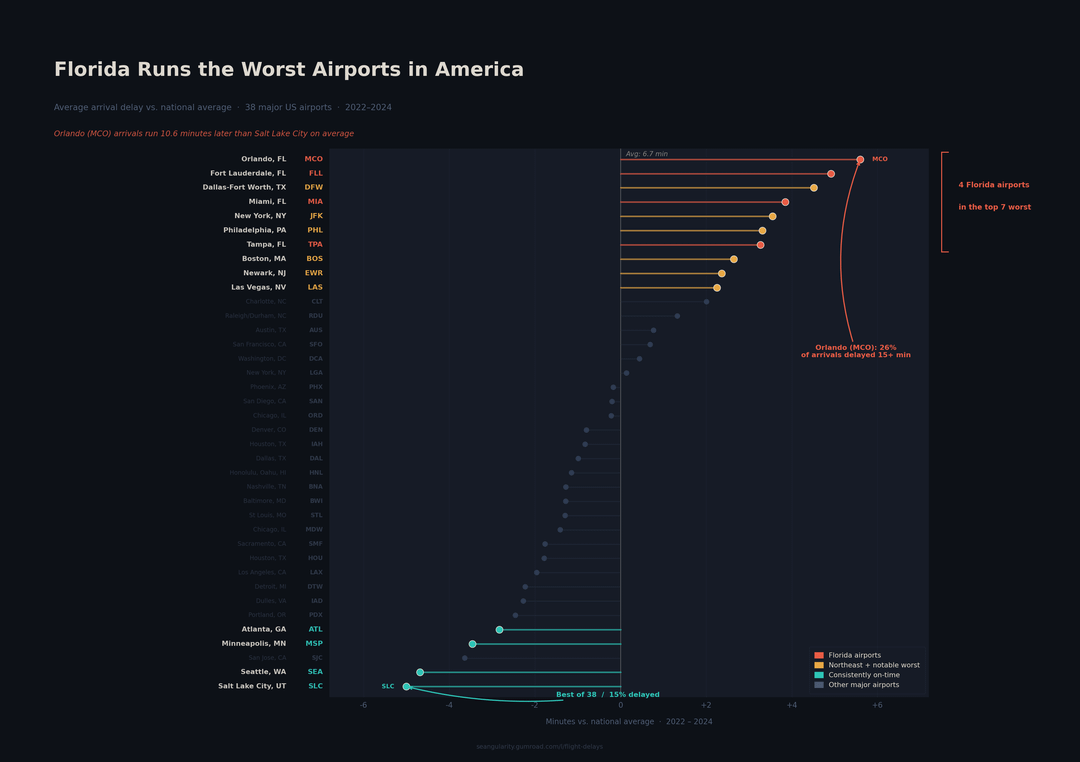
Chart 2 – Florida airports: Orlando (MCO) arrivals run 10.6 minutes later than Salt Lake City on average. 4 of the 7 worst-performing major airports are in Florida. Afternoon thunderstorm season and massive tourist volume on limited infrastructure. Only airports with 50K+ annual departures included.
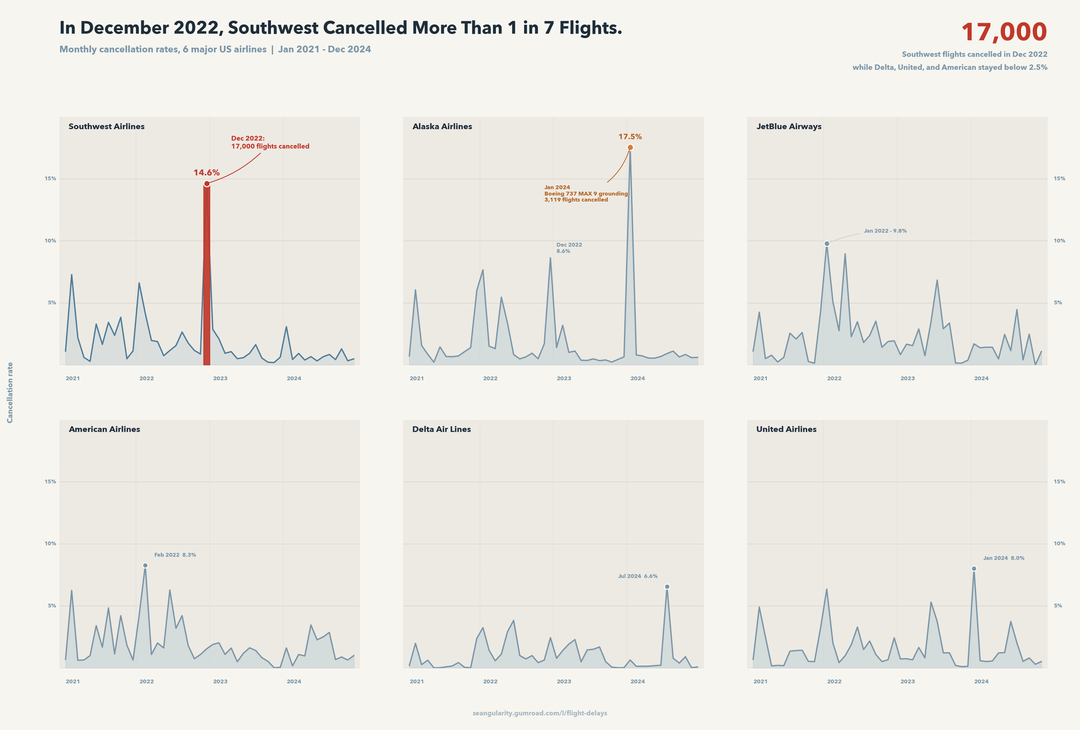
Chart 3 – Cancellations: The Southwest December 2022 meltdown hit 14.6% cancellation rate (~17,000 flights) while Delta, United, and American stayed below 2.5% the same month. Southwest’s point-to-point network couldn’t recover from cascading crew misplacements the way hub-and-spoke carriers could. The Alaska January 2024 spike (17.5%) is the 737 MAX 9 grounding after the door plug blowout.
No-Acanthaceae-5087 on
Yeah I fly a lot. Like a lot lot. Miami is one of the worst airports on earth.
data_daria55 on
looks like more of the delay share is coming from late aircraft and system congestion, not pure carrier fault

3 Comments
Tools: Python (matplotlib, pandas)
Source dataset (route-level + airport-level, 580K rows): [pivode.github.io](http://pivode.github.io)
Three angles from the same dataset:
Chart 1 – Delay causes: Carrier delays (things airlines directly control) dropped from 41% of total delay time in 2020 to 31% in 2024. But the late aircraft cascade – one delayed plane making every downstream flight late – grew to fill the gap. Total delay minutes per delayed flight are higher now than before the 2021 demand surge.
Chart 2 – Florida airports: Orlando (MCO) arrivals run 10.6 minutes later than Salt Lake City on average. 4 of the 7 worst-performing major airports are in Florida. Afternoon thunderstorm season and massive tourist volume on limited infrastructure. Only airports with 50K+ annual departures included.
Chart 3 – Cancellations: The Southwest December 2022 meltdown hit 14.6% cancellation rate (~17,000 flights) while Delta, United, and American stayed below 2.5% the same month. Southwest’s point-to-point network couldn’t recover from cascading crew misplacements the way hub-and-spoke carriers could. The Alaska January 2024 spike (17.5%) is the 737 MAX 9 grounding after the door plug blowout.
Yeah I fly a lot. Like a lot lot. Miami is one of the worst airports on earth.
looks like more of the delay share is coming from late aircraft and system congestion, not pure carrier fault