
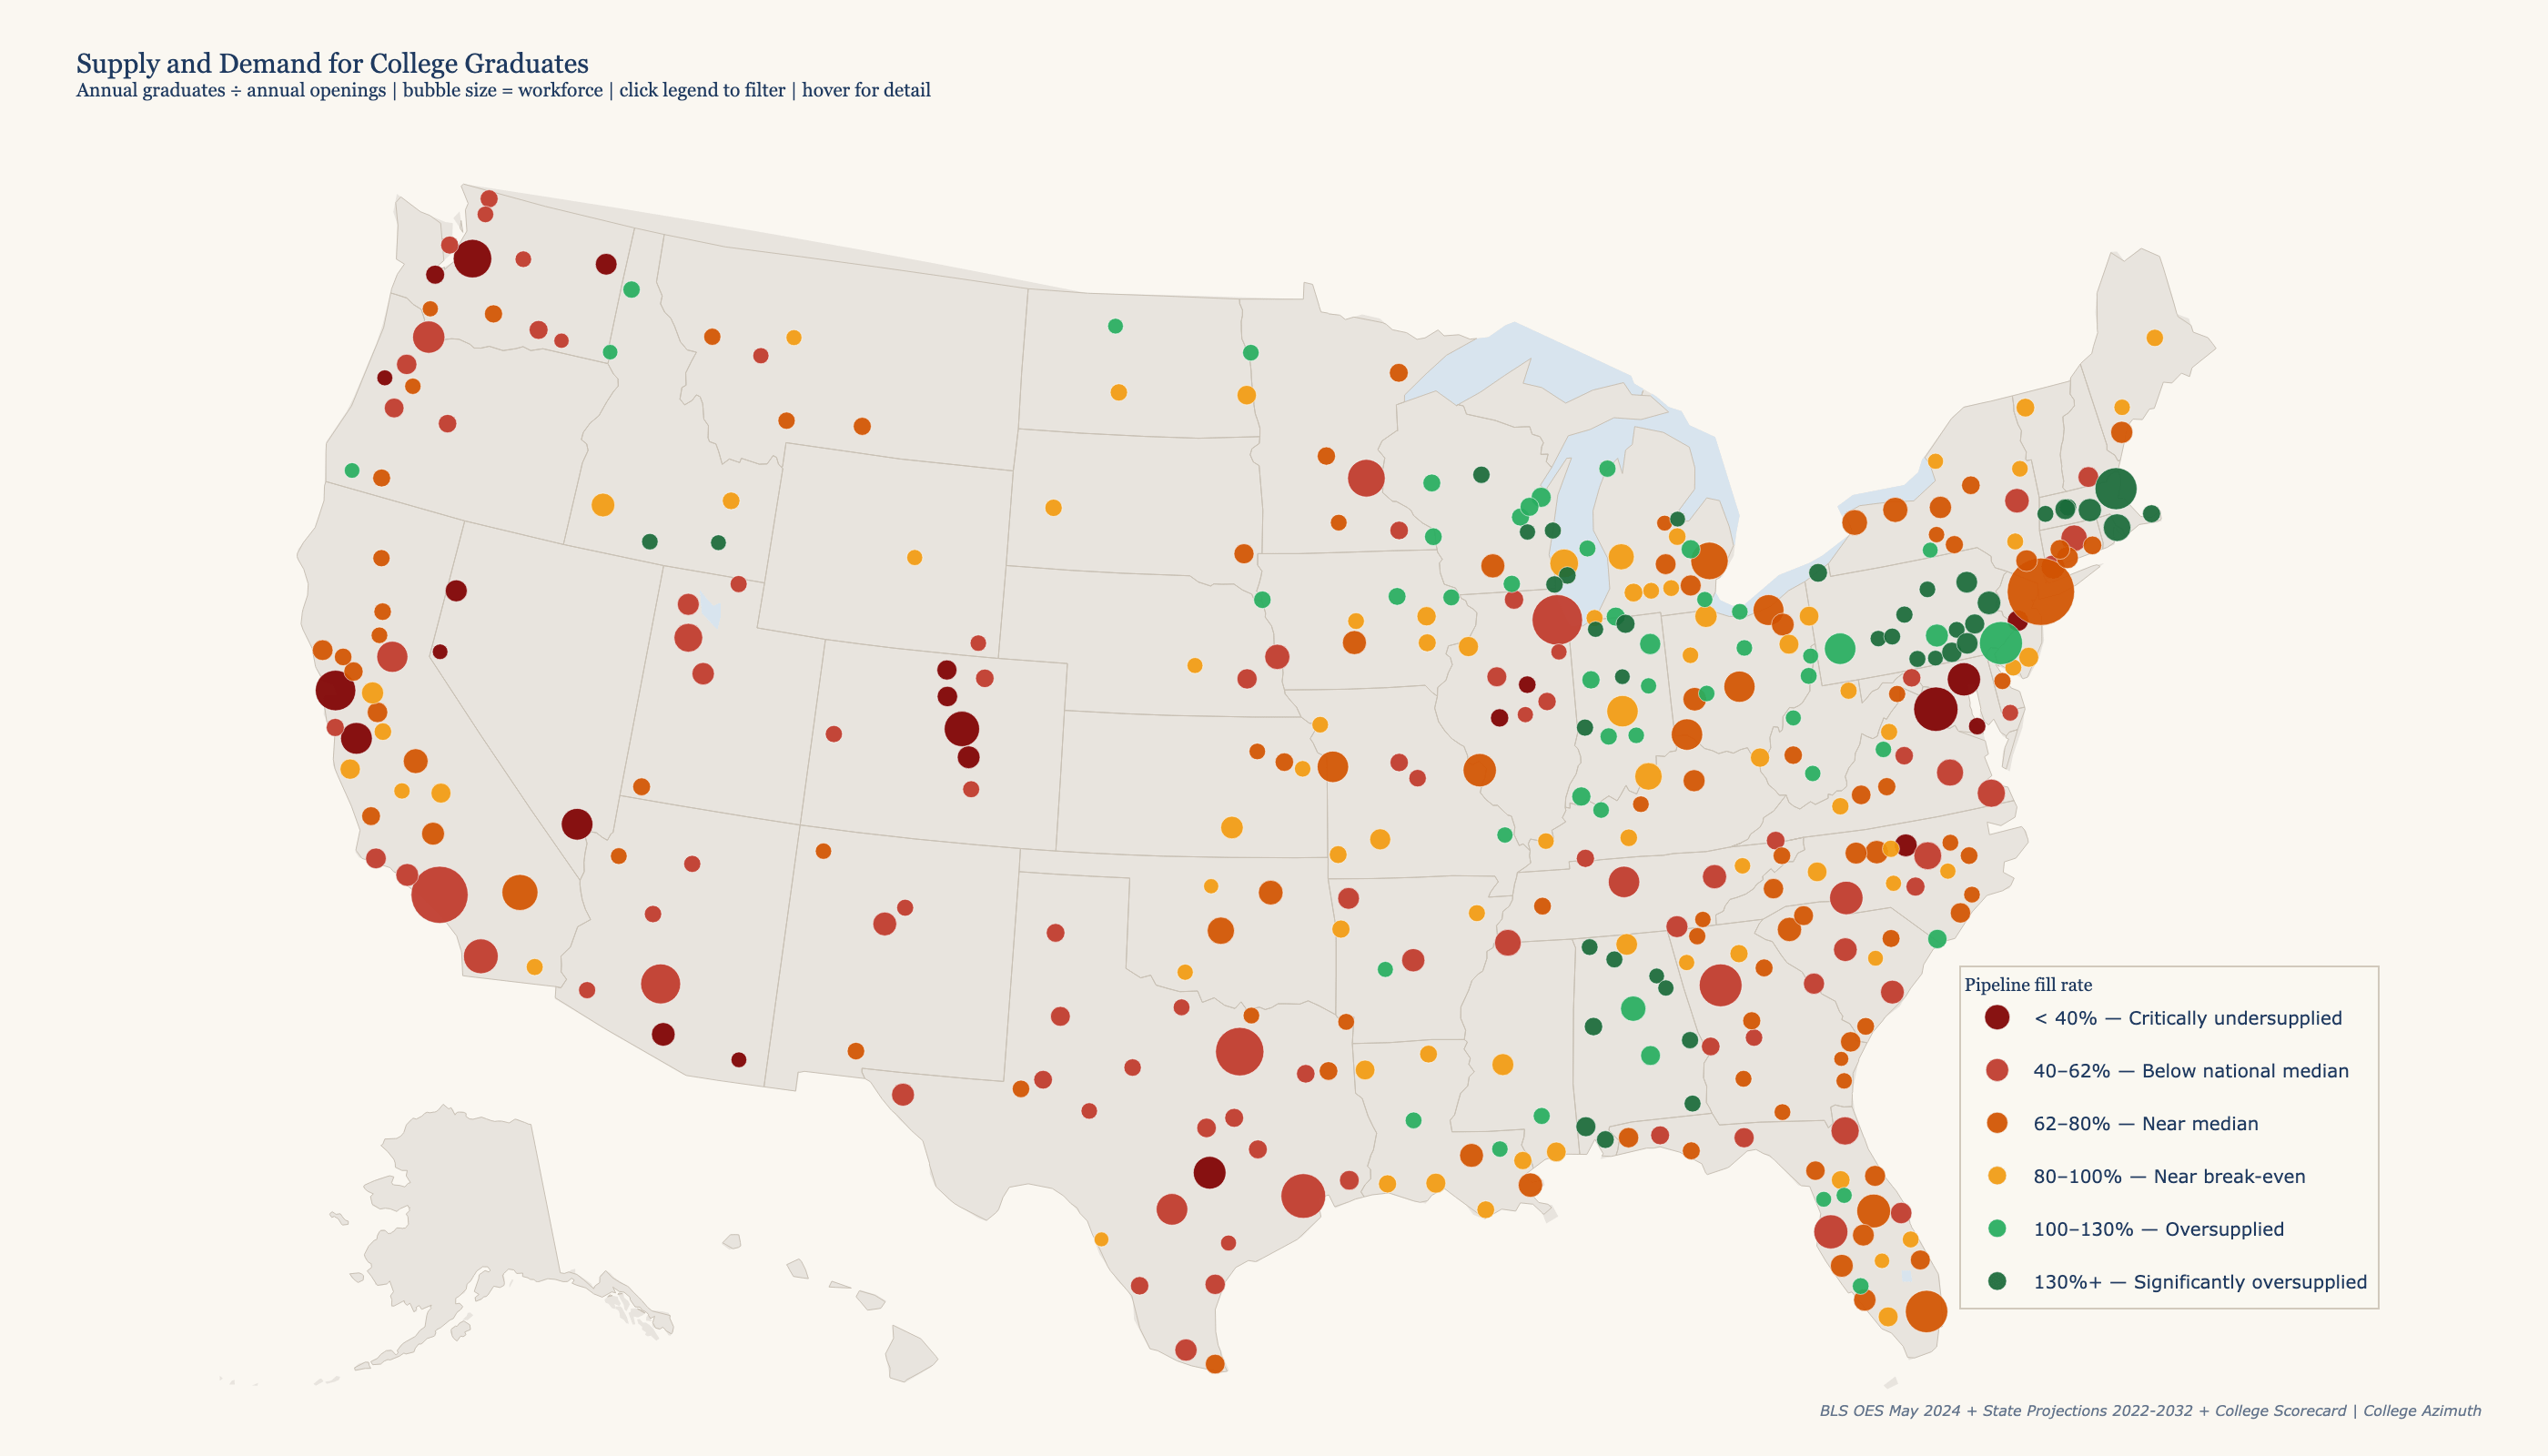
[OC] Data sources & methodology
What I measured: Annual bachelor's graduate output vs. annual job openings requiring a bachelor's degree, for 391 US metro areas. The output is one number per metro — a pipeline fill rate (annual grads ÷ annual openings).
Data:
- BLS OES May 2024 — metro-level employment by occupation
- State occupational projections (Projections Central 2022–2032) — 10-year forecasts for growth + separations by state
- College Scorecard — annual graduate counts by program and institution
Method: Graduates are pooled at the state level and distributed to each metro proportionally by employment share. A UT Austin grad is as likely to end up in Dallas or Houston as Austin — this models that. Does not capture interstate migration, community college pipelines, or career changers.
Tool: Python (pandas, plotly)
Full writeup: https://collegeazimuth.com/analysis/supply-demand-map-college-degrees/
by DanielAZ923
3 Comments
Data: BLS OES May 2024 + State Occupational Projections 2022–2032 + College Scorecard | Analysis by Daniel Rogers (me) at College Azimuth
[Link to interative plotly map](https://collegeazimuth.com/data/metro-supply-demand-map/)
Full Methodology: [https://collegeazimuth.com/analysis/supply-demand-map-college-degrees/](https://collegeazimuth.com/analysis/supply-demand-map-college-degrees/)
Idk what to derive from this. I’m assuming all of these jobs requiring a bachelors are drastically underpaying, so everyone is going for the same jobs? I thought the job market was tough.
Sf does not want college graduates they want math, physics, and comp sci phds but not all of them just those that use the math relevant to llms.