
*Methodology & Sources*:
What you’re looking at:
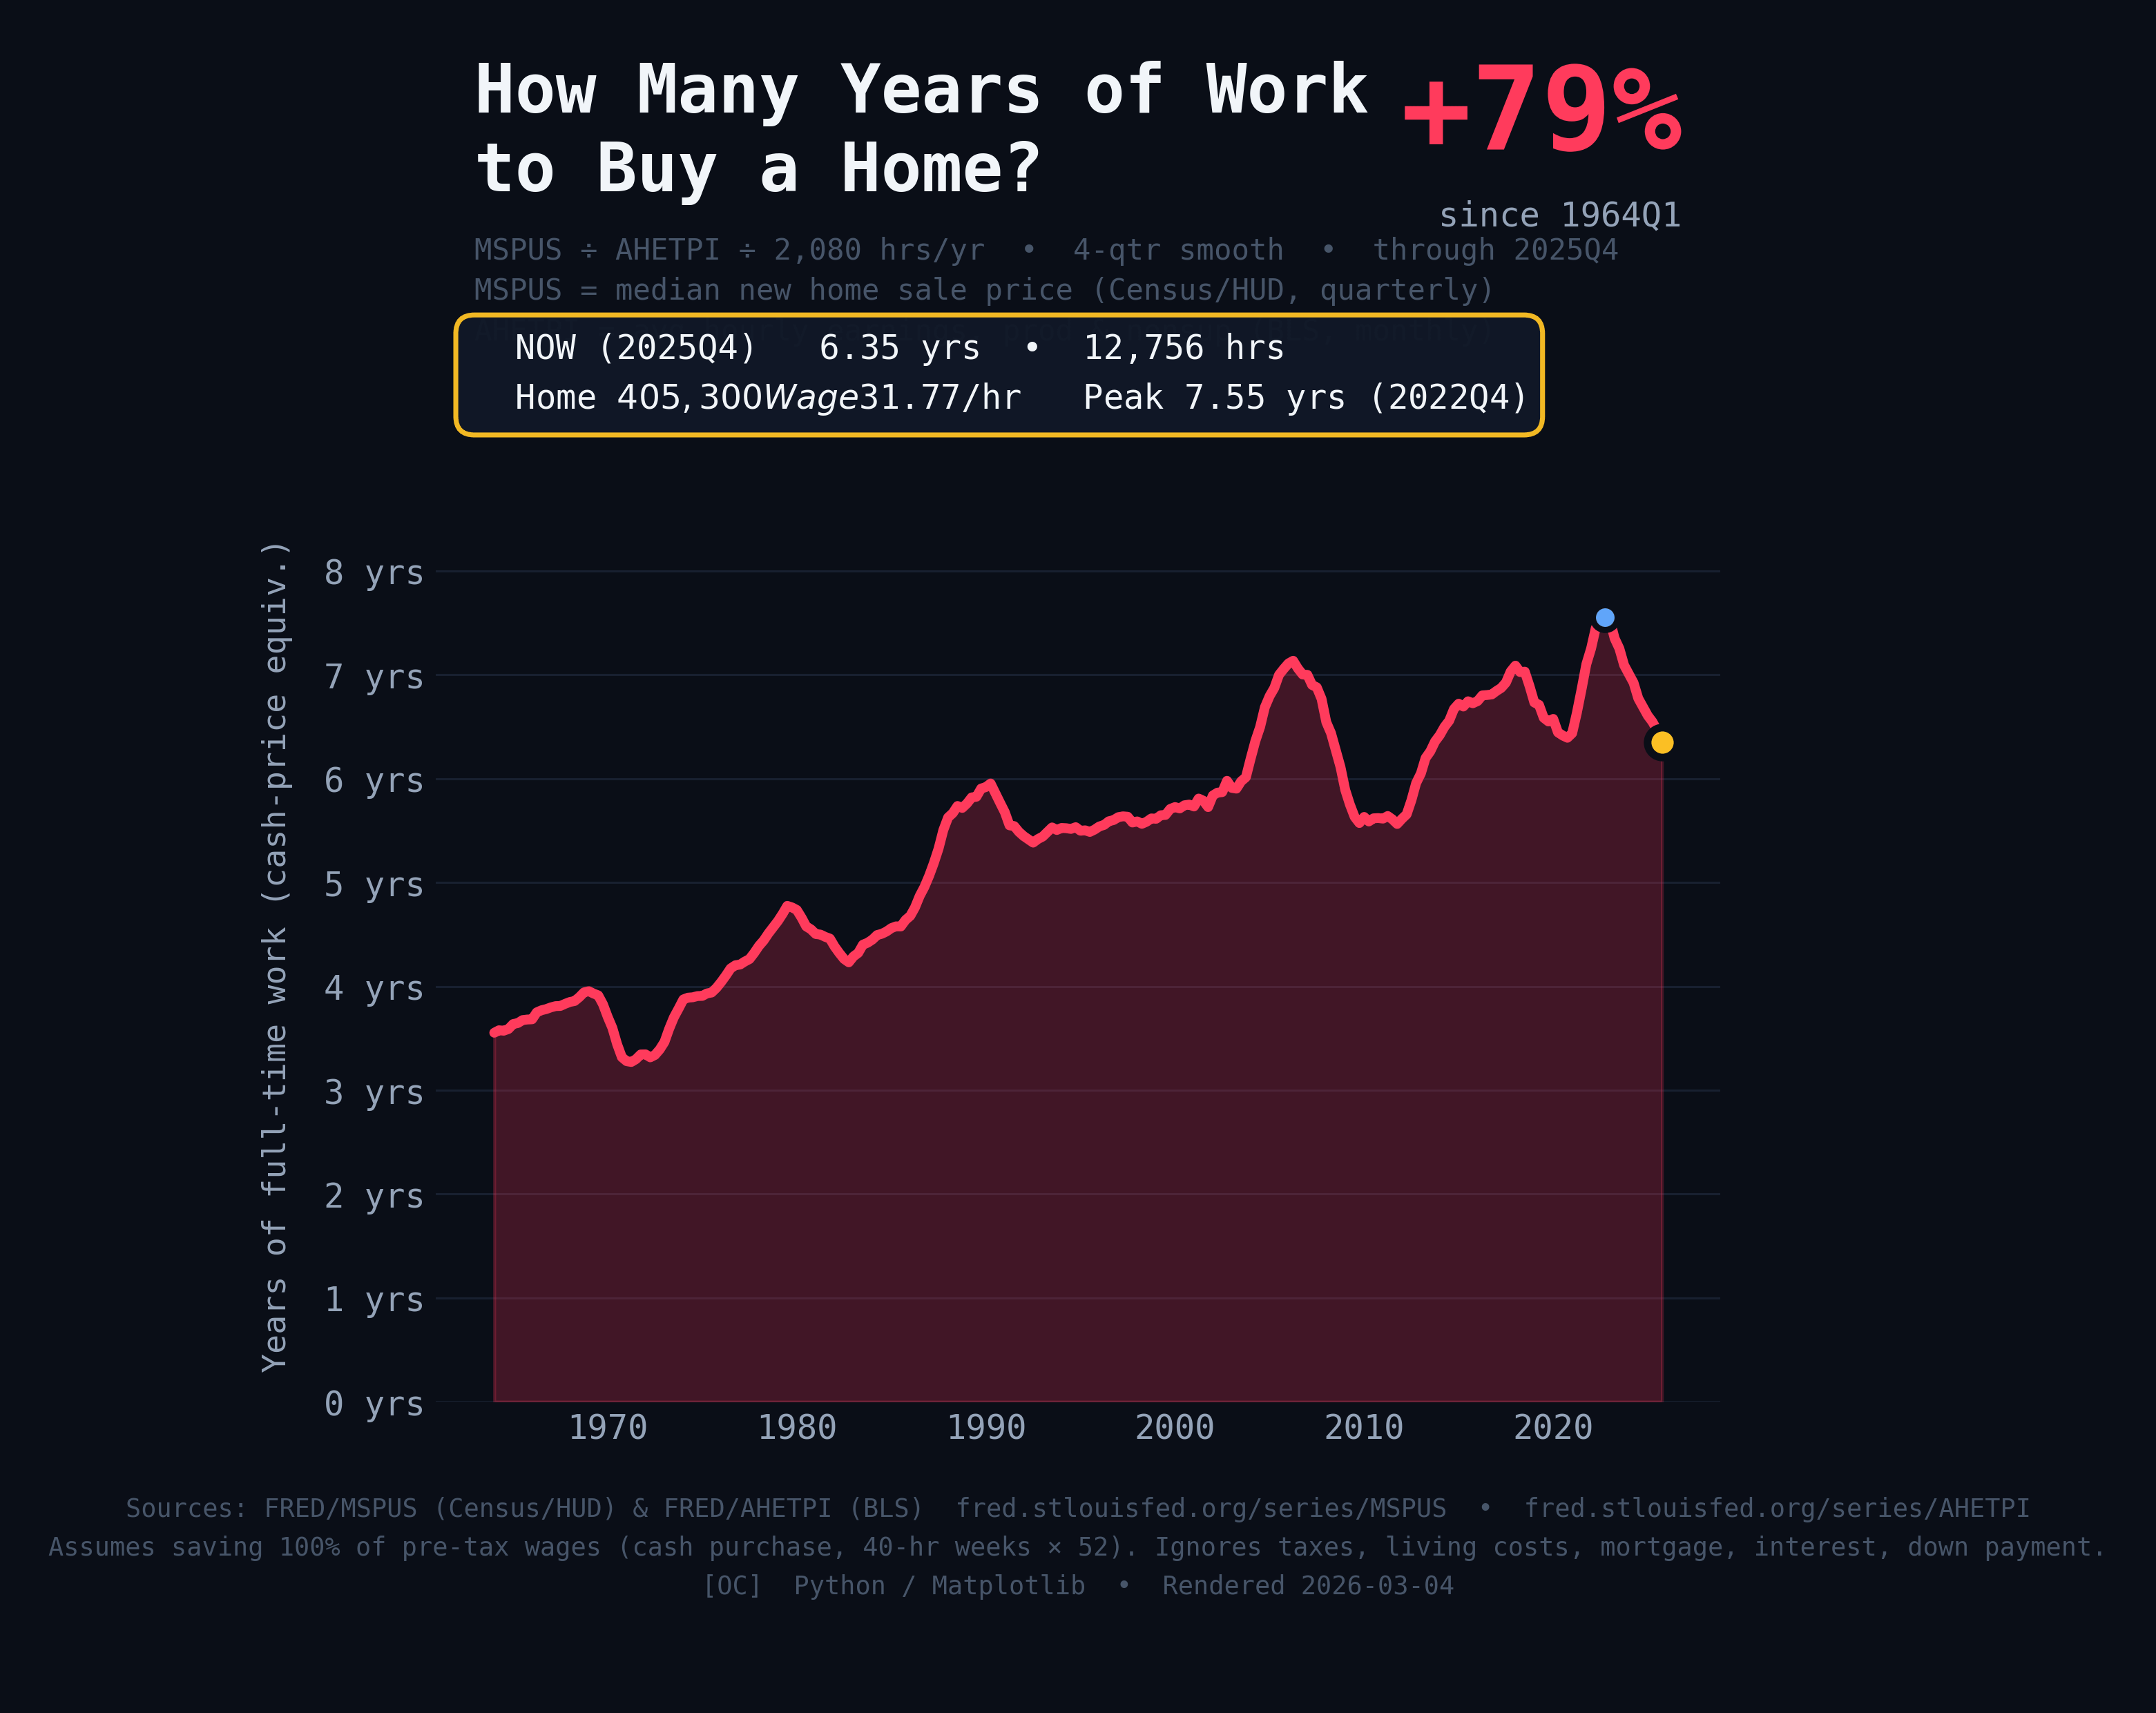
• Years of full‑time work (2,080 hrs/yr) needed to equal the median US home sale price.
Formula:
• years = (MSPUS home price ÷ AHETPI hourly wage) ÷ 2,080
Data (FRED, pulled at render time; no hand-entered numbers):
• MSPUS = Median Sales Price of Houses Sold (Census/HUD, quarterly; new home sales series)
• AHETPI = Avg hourly earnings, production & nonsupervisory, total private (BLS, monthly, seasonally adjusted)
Processing:
• Converted wages to quarterly averages to match MSPUS.
• Applied a 4‑quarter rolling mean to reduce quarter-to-quarter noise (MSPUS isn’t seasonally adjusted).
Important caveats (so we don’t talk past each other):
• NOT a mortgage affordability chart (ignores interest rates, down payments, credit constraints).
• Pre‑tax and assumes 100% saving (ignores taxes + all living costs), so real “years” would be higher.
• National series: local markets can look very different.
Sources:
by labubugotmyheart
3 Comments
Houses are 70% bigger. Population has more than doubled packed into the same amount of land. Houses have more advanced hvac, electrical, plumbing, and insulation. Materials are more scarce.
Now compare square footage of the median 1964 home to the square footage of today’s homes.
This data isn’t beautiful. Your assumptions are rough and show a bias. Median home to median home has changed over the time and ignoring interest rates and their impact on home prices is a poor decision.
This is “I wanted to tell a story and cherry-picked some graphs”