
data source: GFS forecast from UCAR server
data viz: ParaView
data link: https://www.unidata.ucar.edu/data/nsf-unidatas-thredds-data-server
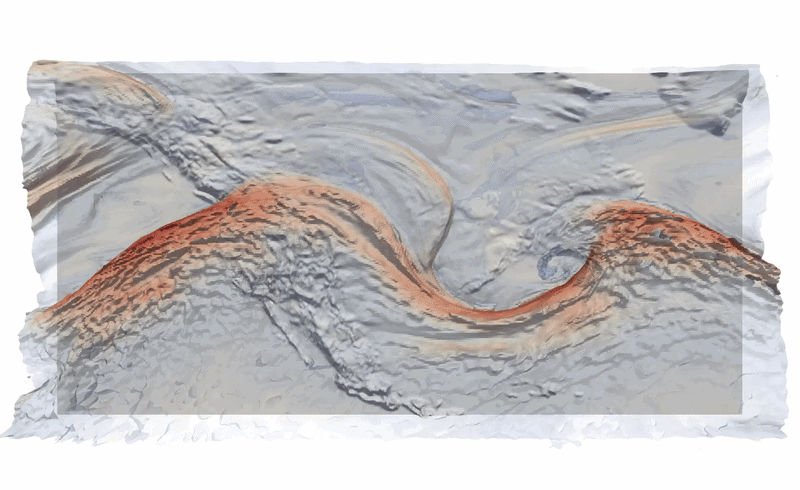
The surface topography is shown as the lower opaque layer and the tropopause is shown as the upper semi-transparent layer, with red shading indicating the fast winds of the jet stream. The vertical extent of topography and tropopause height is proportional but greatly exaggerated.
The tropopause is the boundary between the troposphere, the lowest layer of the atmosphere, and the stratosphere, the layer above it. This boundary is higher in the warm tropics and lower in the cold polar regions and the jet stream runs along that temperature contrast. Strong storms are associated with waves in the jet stream and the tropopause being pulled down close to the surface.
Mathew Barlow
Professor of Climate Science
University of Massachusetts Lowell
by Mathew_Barlow
2 Comments
Is the tropopause all the way at sea level in that spot off the East Coast, or just very very close to it?
Now that’s some beautiful data!