
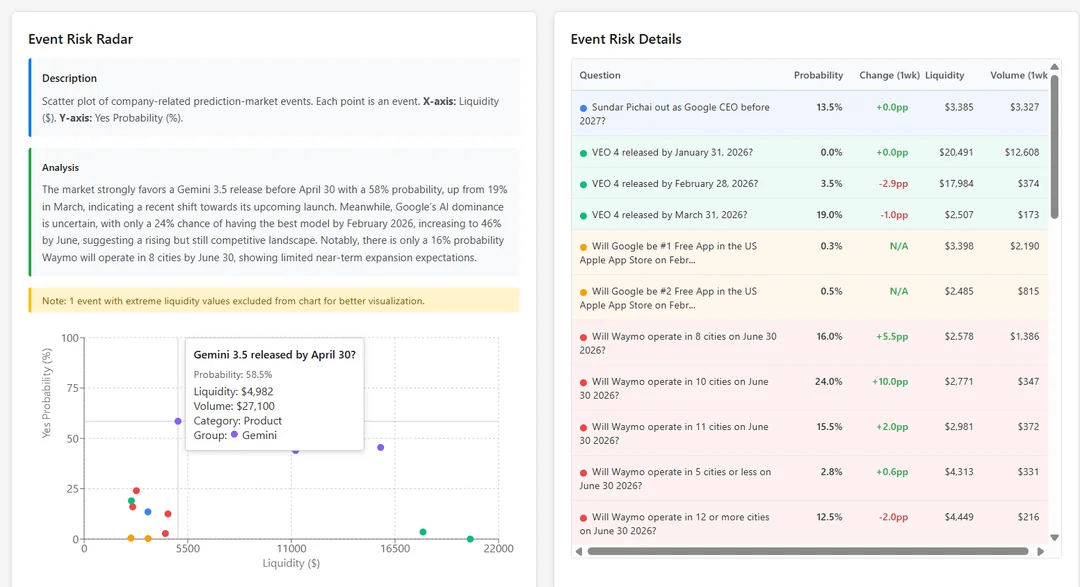
The Google Event Risk Radar uses prediction market data to chart the probability of Google related events occuring. Probbaility is included in the Y-Axis and Liquidity (think sample size) is included in the X-axis. Colors indicate groups of events.
Source: Implied-Data.com
by BadBoyBrando