
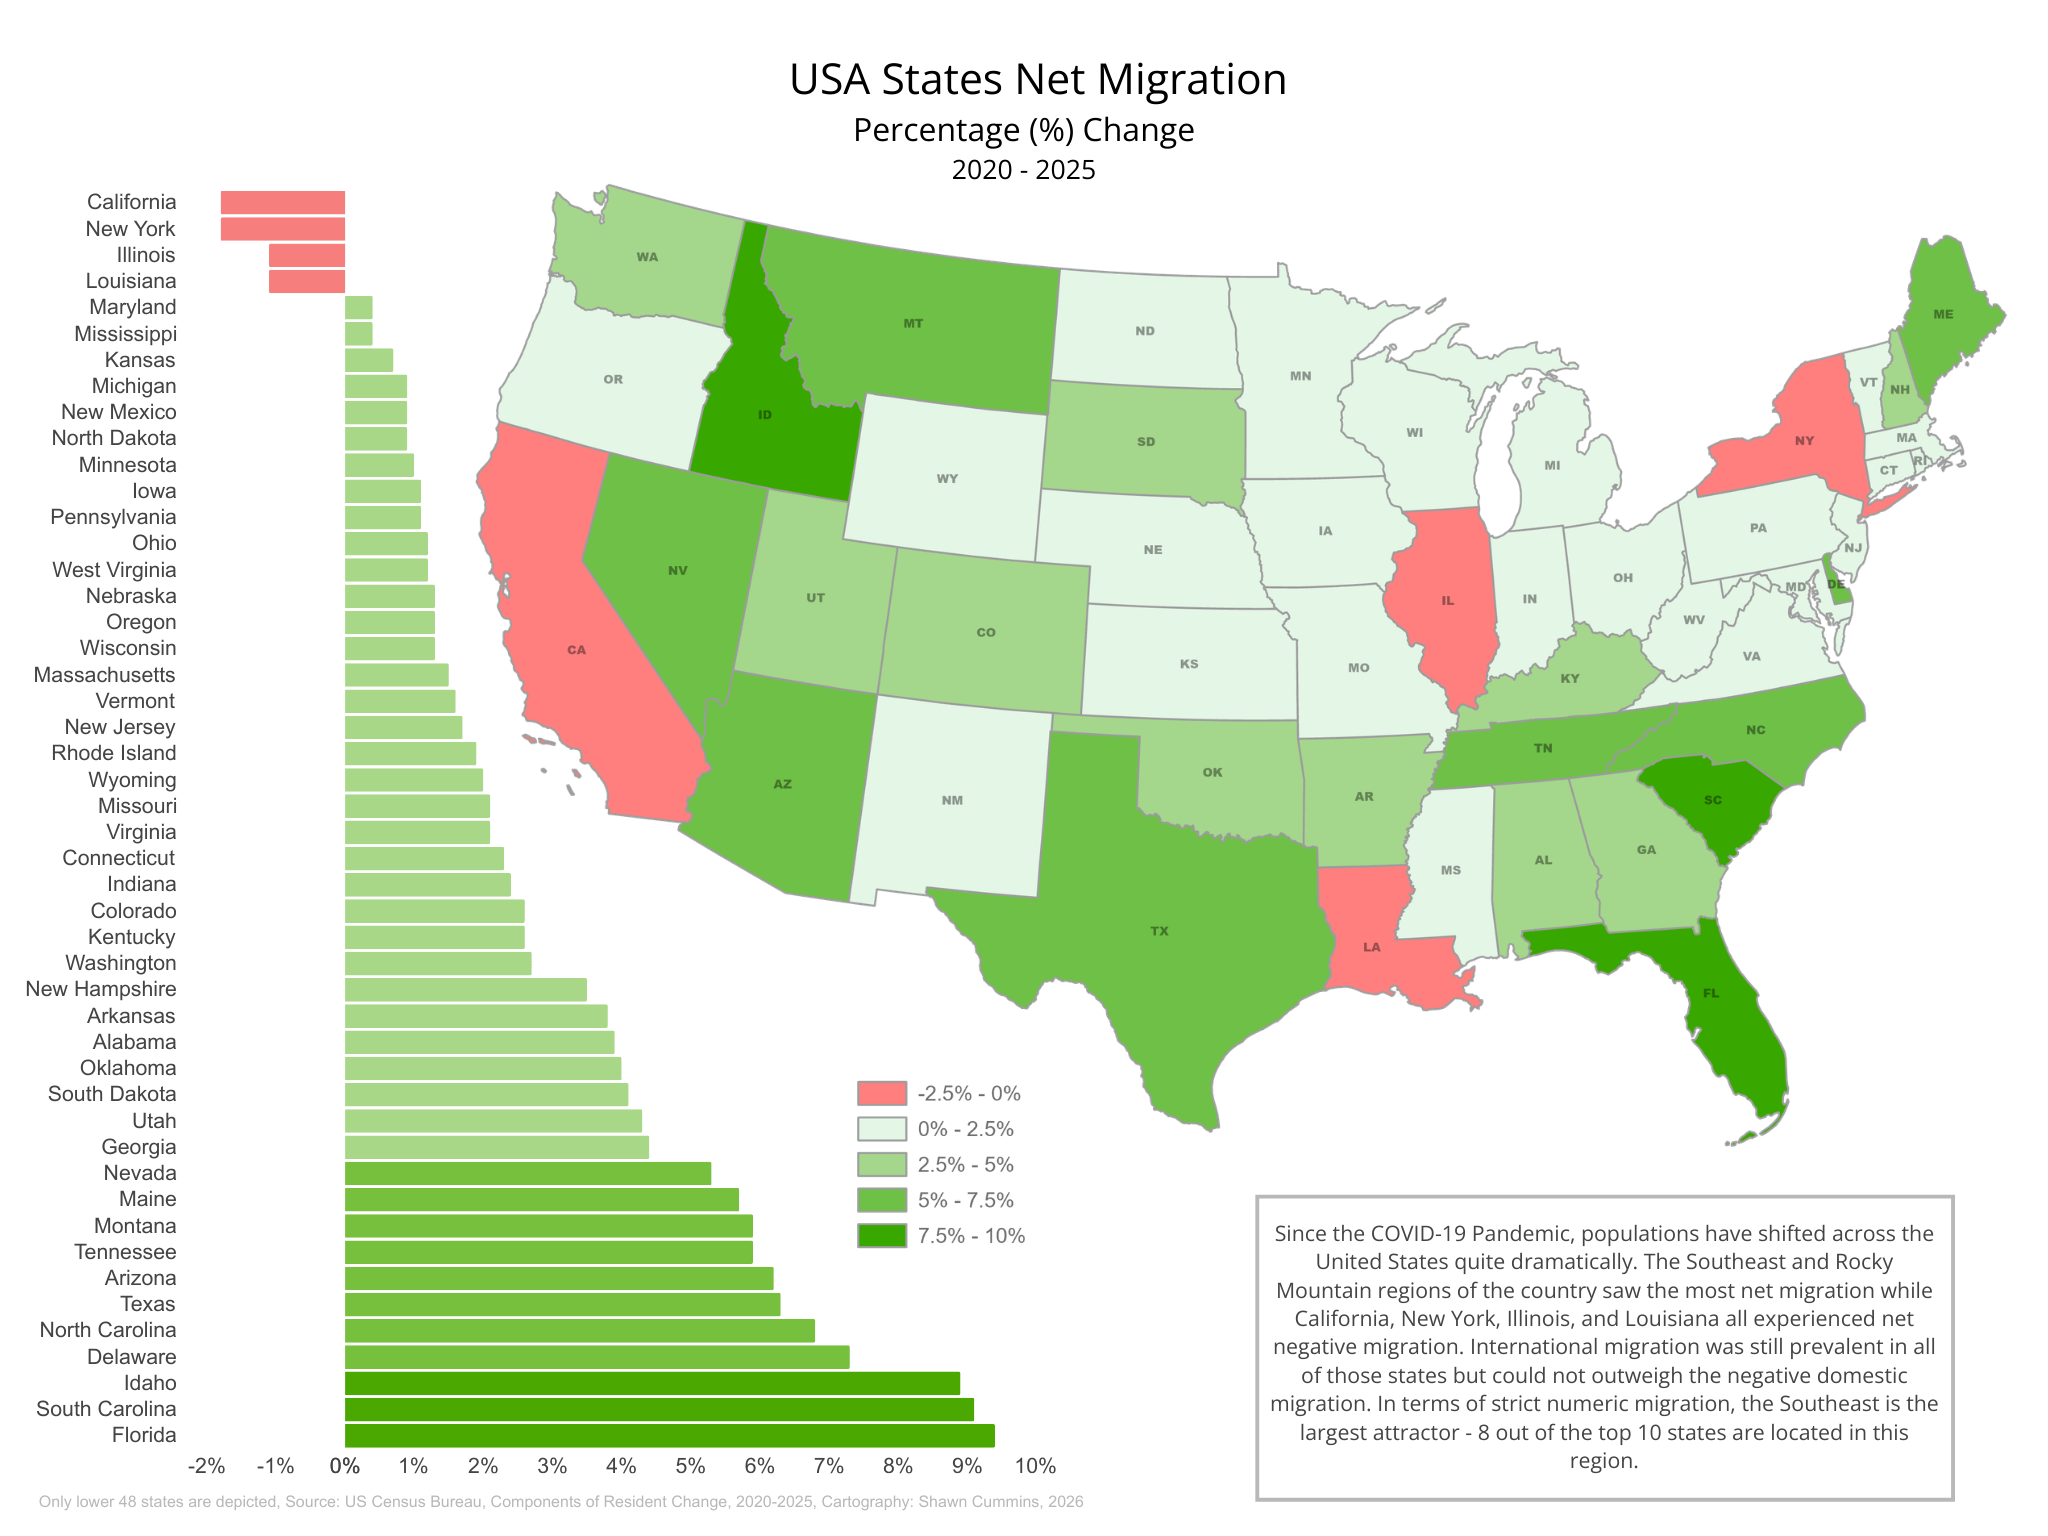
Some visuals I made using the 2020 – 2025 State components of change data the US Census Bureau recently released. Decided to show a percentage change value rather than straight up numeric change to highlight the impact on some these states that saw a huge influx of people after COVID comparative to their pre-COVID population levels. I also aggregated interntaional and domestic migration.
Any feedback on this is welcome!
by whenuknow
10 Comments
Data Source: US Census Vintage 2025, Population Estimates, Population Change, and Components of Change [https://www.census.gov/data/tables/time-series/demo/popest/2020s-state-total.html](https://www.census.gov/data/tables/time-series/demo/popest/2020s-state-total.html)
Tools Used: ArcGIS Pro for the map, Canva for the design and charts
It would be beautiful if you used all the states
Is this using literal census data (like NY’s population was ~2.5% lower in 2025 than it was in 2020) or is it specifically tracking people that have moved from one state to another?
If the former, then would it make sense to consider fertility rates by state? IE, are people moving to Idaho and away from Illinois or is it skewed a bit by Idaho’s 1.79 fertility rate and Illinois’ 1.50 (data from 2023)?
We’re already seeing some of those Covid-era trends reverse though. Here in Florida we’re experiencing the worst housing market since the great financial crisis and our net migration numbers are back down to 2009 levels.
Why are people leaving Louisiana?
No why are people coming to Delaware. We have enough people, please stop.
Funny because Florida is literally the last state I would want to move to.
Oregon is so funny to me. Historically, my family had a logging operation outside of Portland and they eventually sold the land (lake Oswego) which became an expensive subdivision.
I now live in California but Oregonians don’t want former Californian residents there, SO if I wanted to stay west, i would go to Washington.
Edit ..son went to Oregon State, husband’s best friend and several of mine live there.
They new yorked my new jersey in a hurry.
Didn’t know US only has 48 states.